Question
The following diagram shows the graph of a function \(f\), for −4 ≤ x ≤ 2.
On the same axes, sketch the graph of \(f\left( { – x} \right)\).
Another function, \(g\), can be written in the form \(g\left( x \right) = a \times f\left( {x + b} \right)\). The following diagram shows the graph of \(g\).
Write down the value of a and of b.
Answer/Explanation
Markscheme
A2 N2
[2 marks]
recognizing horizontal shift/translation of 1 unit (M1)
eg b = 1, moved 1 right
recognizing vertical stretch/dilation with scale factor 2 (M1)
eg a = 2, y ×(−2)
a = −2, b = −1 A1A1 N2N2
[4 marks]
Question
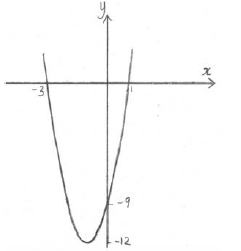
Let \(f(x) = 3{(x + 1)^2} – 12\) .
Show that \(f(x) = 3{x^2} + 6x – 9\) .[2]
For the graph of f
(i) write down the coordinates of the vertex;
(ii) write down the equation of the axis of symmetry;
(iii) write down the y-intercept;
(iv) find both x-intercepts.[8]
Hence sketch the graph of f .[2]
Let \(g(x) = {x^2}\) . The graph of f may be obtained from the graph of g by the two transformations:
a stretch of scale factor t in the y-direction
followed by a translation of \(\left( {\begin{array}{*{20}{c}}
p\\
q
\end{array}} \right)\) .
Find \(\left( {\begin{array}{*{20}{c}}
p\\
q
\end{array}} \right)\) and the value of t.[3]
Answer/Explanation
Markscheme
\(f(x) = 3({x^2} + 2x + 1) – 12\) A1
\( = 3{x^2} + 6x + 3 – 12\) A1
\( = 3{x^2} + 6x – 9\) AG N0
[2 marks]
(i) vertex is \(( – 1{\text{, }} – 12)\) A1A1 N2
(ii) \(x = – 1\) (must be an equation) A1 N1
(iii) \((0{\text{, }} – 9)\) A1 N1
(iv) evidence of solving \(f(x) = 0\) (M1)
e.g. factorizing, formula,
correct working A1
e.g. \(3(x + 3)(x – 1) = 0\) , \(x = \frac{{ – 6 \pm \sqrt {36 + 108} }}{6}\)
\(( – 3{\text{, }}0)\), \((1{\text{, }}0)\) A1A1 N1N1
[8 marks]
 A1A1 N2
Note: Award A1 for a parabola opening upward, A1 for vertex and intercepts in approximately correct positions.
[2 marks]
\(\left( {\begin{array}{*{20}{c}}
p\\
q
\end{array}} \right) = \left( {\begin{array}{*{20}{c}}
{ – 1}\\
{ – 12}
\end{array}} \right)\) , \(t = 3\) (accept \(p = – 1\) , \(q = – 12\) , \(t = 3\) ) A1A1A1 N3
[3 marks]
Question
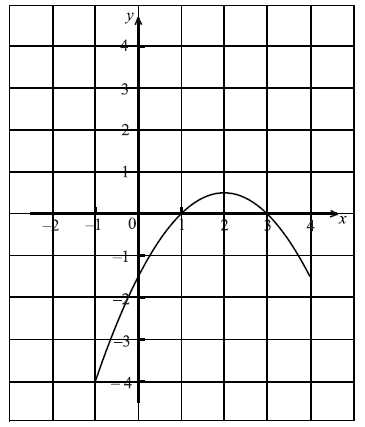
Part of the graph of a function f is shown in the diagram below.

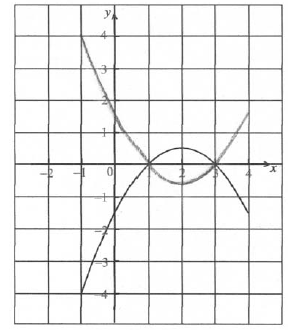
On the same diagram sketch the graph of \(y = – f(x)\) .
Let \(g(x) = f(x + 3)\) .
(i) Find \(g( – 3)\) .
(ii) Describe fully the transformation that maps the graph of f to the graph of g.
Answer/Explanation
Markscheme
 M1A1 N2
Note: Award M1 for evidence of reflection in x-axis, A1 for correct vertex and all intercepts approximately correct.
(i) \(g( – 3) = f(0)\) (A1)
\(f(0) = – 1.5\) A1 N2
(ii) translation (accept shift, slide, etc.) of \(\left( {\begin{array}{*{20}{c}}
{ – 3}\\
0
\end{array}} \right)\) A1A1 N2
[4 marks]
Question
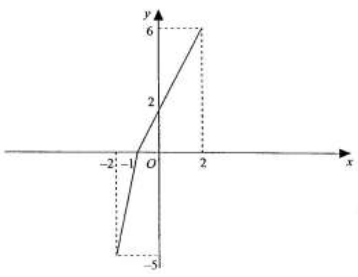
Consider the following graph of a function y = f(x)
Sketch the graphs of the following functions (a) y = f(x) – 1 (b) \(y = \frac{f(x)}{x}\) (c) y = -f(x) (d) y = f(x-1) (e) \(y = f(\frac{x}{2})\) (f) y = f(-x) (g) \(y=\begin{vmatrix}f(x)\end{vmatrix}\) (h) \(y=f(\begin{vmatrix} x \end{vmatrix})\) (g)\(=2f(\frac{1}{2}(x-1))\)
Answer/Explanation
Ans
Solutions are not provided