IBDP Geography -Option A -Flooding and flood mitigation-IB style Questions HLSL Paper 1

Question

The map shows the location of the Danjiangkou Dam on the Han River in China. The graphs show the sediment loads at three places (A, B, C) downstream of the dam.

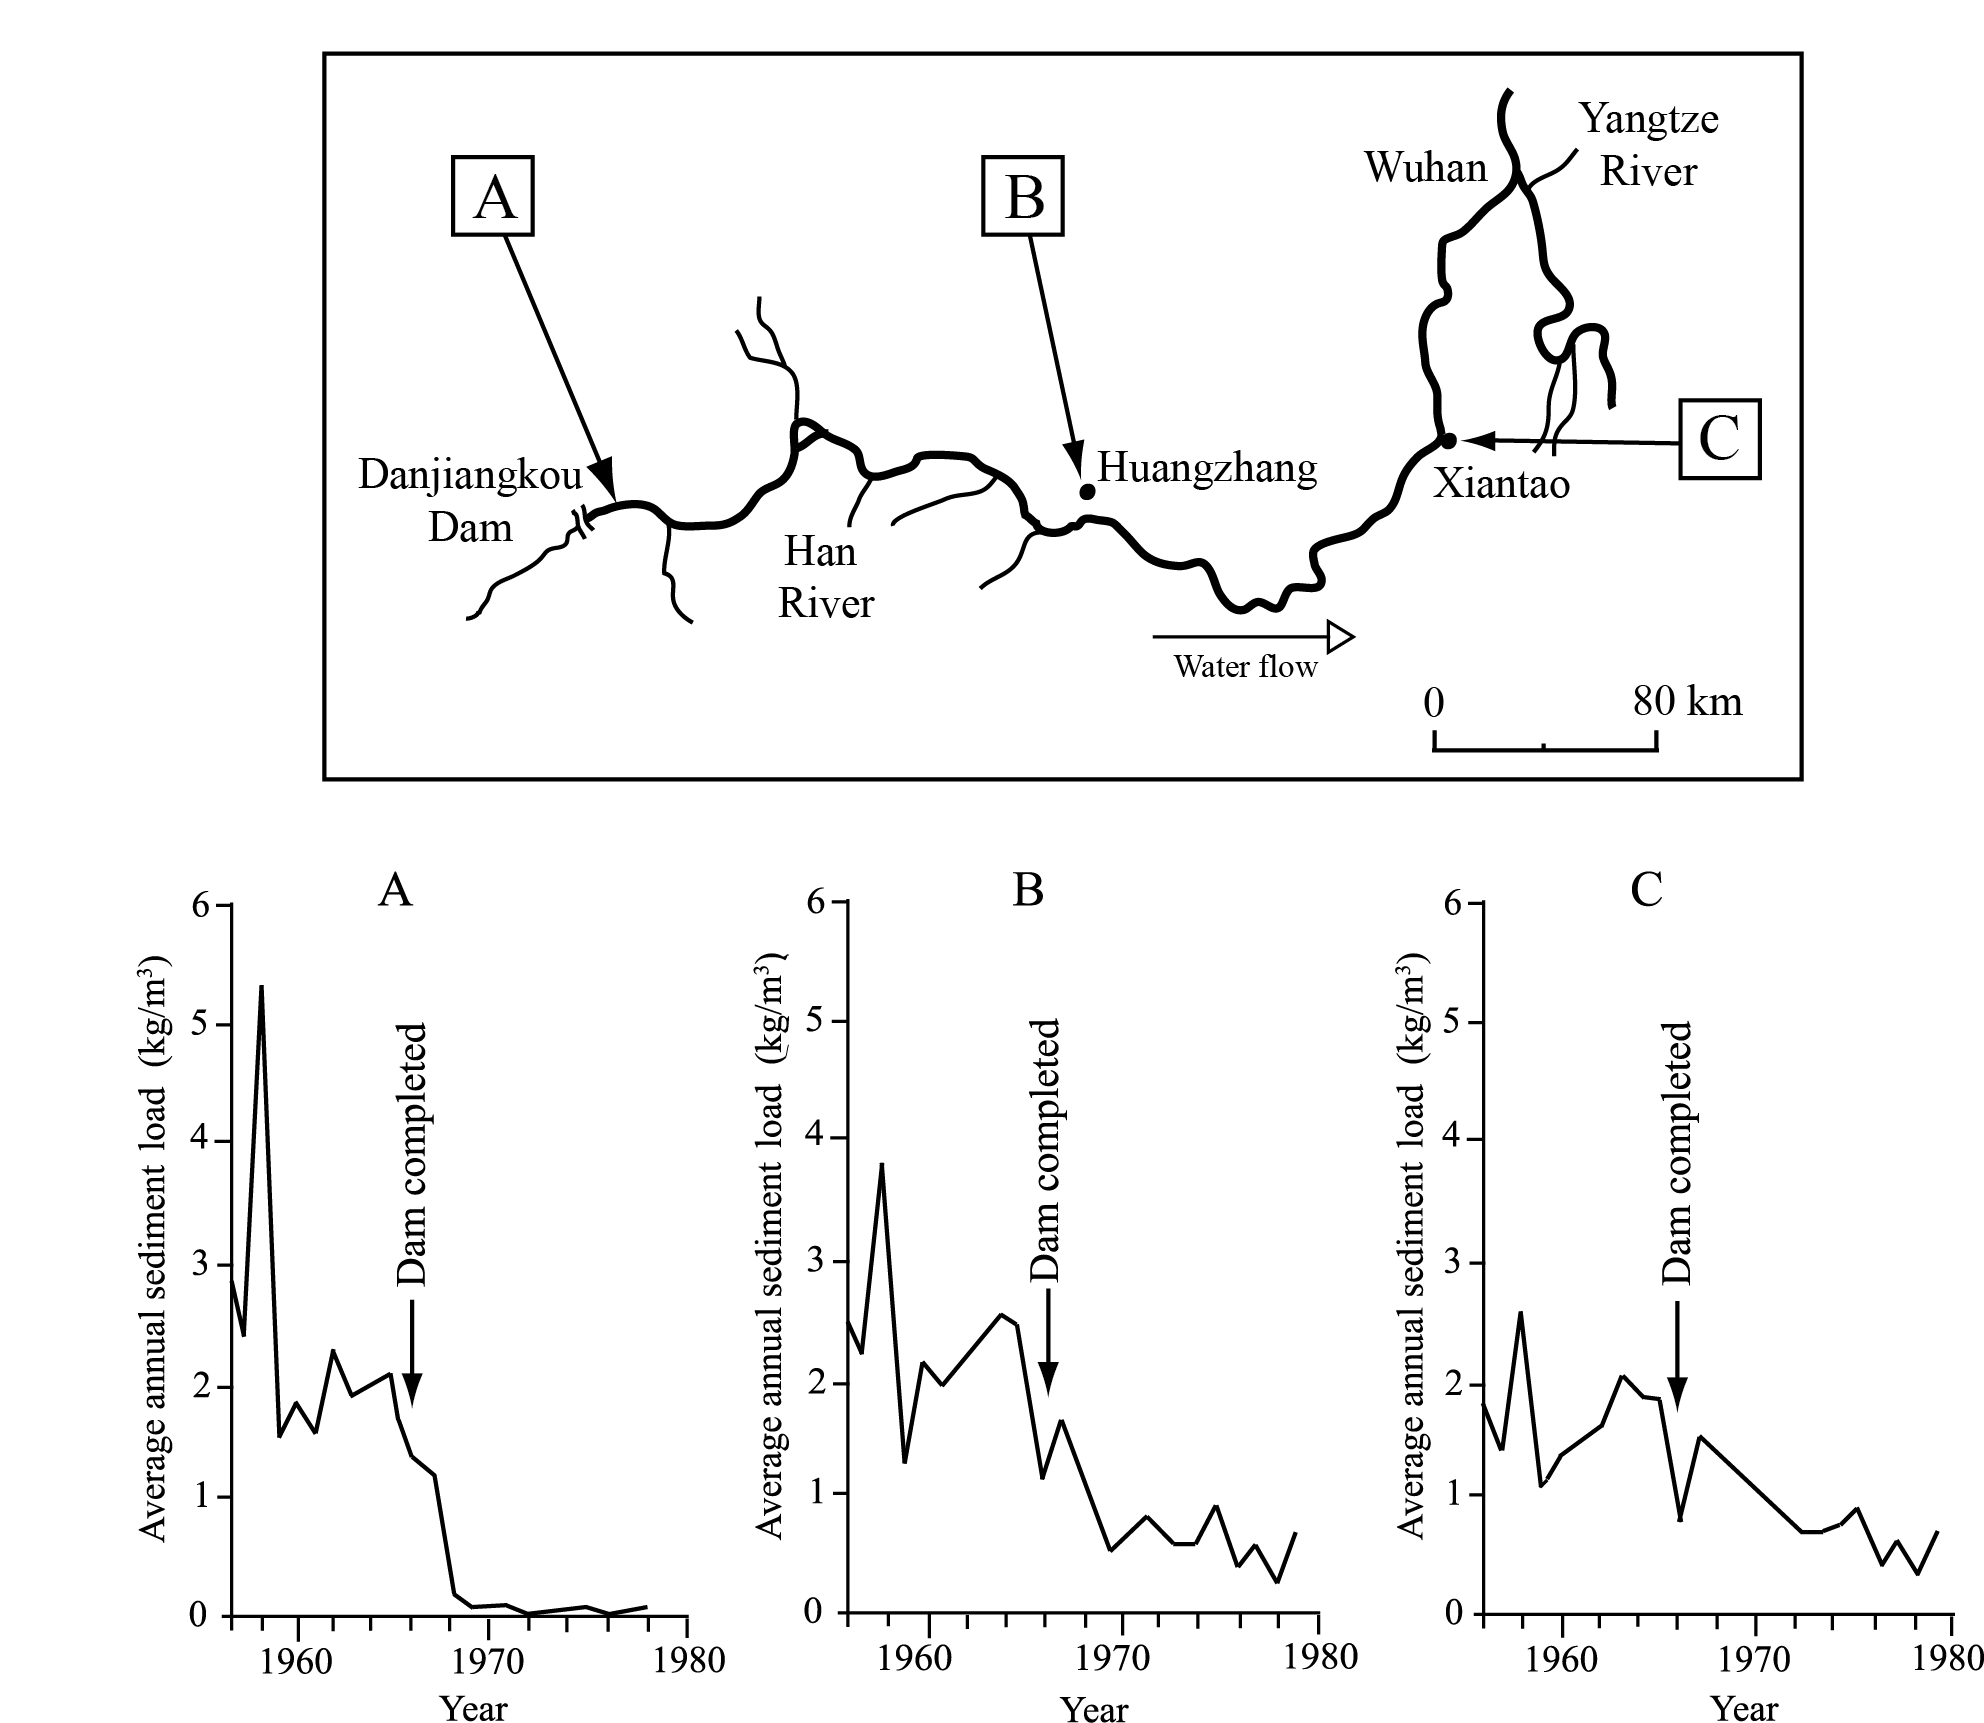
State the year when the highest sediment load occurred. [1]

ai.

State the volume of sediment load in that year at Huangzhang.[1]

aii.

Identify three ways in which the load of a river is transported and briefly describe one of these ways[3]

b.

Referring to the map and graphs, explain how the construction of the Danjiangkou Dam affected sediment loads along the Han River.[5]

c.

Examine the influences of physical factors and human activity on a specific river flood.[10]

d.
▶️Answer/Explanation

Markscheme

1958.

ai.

Accept answers from 3.7 – 3.8 kg/m3 inclusive. Units are required.

aii.

Answers are likely to be solution; suspension; bed load (though it is equally acceptable for candidates to identify more than one type of bed load movement).

Award 1 mark for two correct ways, 2 marks for three correct ways, with the remaining 1 mark reserved for an appropriate description of one of the ways.

b.

Candidates are expected to describe that, following construction of the dam, sediment load decreased [1 mark] and that sediment flows became less variable [1 mark]. A third mark should be awarded for any recognition that either sediment load or the variability of sediment load diminished more at sites close to the dam than further downstream. The final 2 marks should be reserved for statements explaining these trends or patterns by reference, for example, to the reduction in peak water flows following dam construction, or to the impact of the dam acting as a sediment trap.

Other valid statements can be credited.

c.

Both physical factors (such as the size and shape of the drainage basin; the amount and intensity of precipitation) and human activity (such as land clearance, location of housing, dam construction, flood defences) play a part in river floods, though the balance between the two will vary, depending on the specific river flood chosen.

Answers that examine a specific river flood are likely to be credited at band D and above. It is not necessary for physical factors and human activity to be treated equally. Answers considering both aspects of the question in some detail are likely to be credited at bands E/F.

It is expected that responses will examine one specific river flood, which can be at any scale.

Marks should be allocated according to the markbands.

d.

Question

Draw a labelled diagram of a hydrograph.[4]

a.

Explain how hydrographs are used to forecast floods.[6]

b.

“Dams and reservoirs create as many problems as they solve.” Discuss this statement with reference to multi-purpose schemes.[10]

c.
▶️Answer/Explanation

Markscheme

The hydrograph must include:

  • Labelled axes showing time and discharge [1 mark]
  • Line graph showing discharge [1 mark].

Any additional features or labels are worth 1 mark each, up to a maximum of 2 marks:

  • Labelled rainfall
  • Peak discharge
  • Base flow
  • Lag time
  • Rising or falling limb.
a.

There are many ways in which hydrographs are useful in forecasting floods. Answers could mention prediction of flood height and arrival time downstream using a study of lag times and stream response records. Hydrographs are also used to predict the return period of floods of different sizes through the use of hydrograph records over a long period of time. They may also be used to predict the extent of flooding and how long it will last.

At least two of these should be explained to gain 6 marks.

A strong account of one may compensate for a weaker account of another.

b.

At least one example of a multi-purpose scheme should be named and located.

Solutions might include: the benefits of power generation, water supply, irrigation, transport, flood control, recreation and tourism.

These should be balanced against potential problems that could include: loss of land, displacement of population, loss of water through evaporation, silting, seismic problems, cost, diseases such as bilharzia, loss of nutrients due to flood control, salinization.

To access bands E and F, candidates should discuss both solutions and problems using at least one actual scheme.

Marks should be allocated according to the markbands.

c.

Examiners report

Excellent at both levels, though a few higher level centres erroneously offered climate graphs rather than hydrographs.

a.

Links to forecasting were often tenuous with few references to speed of flood onset, height, duration or return period.

b.

The approach was usually sound, with some truly outstanding responses using detailed case studies and accurate supporting data.

c.

Question

The diagram shows two transport processes that operate in a river channel.

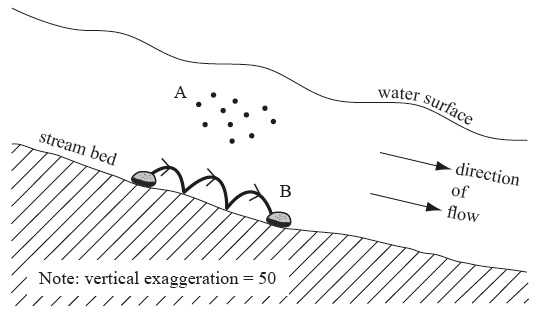
Identify and describe process A and process B shown in the diagram.[4]

a.

Draw a labelled diagram to show the main input, outputs, transfers and stores of the hydrological cycle for an un-vegetated drainage basin.[6]

b.

“Of all the impacts of agriculture on water quality, salinization is the most damaging.” Discuss this statement.[10]

c.
▶️Answer/Explanation

Markscheme

A – Suspension [1 mark] – finer load carried along in the channel above the bed [1 mark].

B – Saltation [1 mark] – coarser material bounces along the river bed [1 mark].

a.
  • Input: precipitation [1 mark].
  • Outputs: evaporation/run-off/river discharge [1 mark].
  • Transfers: must have at least four for two marks (or two for one mark): infiltration, throughflow, overland flow, groundwater flow/base-flow [2 marks].
  • Stores: must have at least four for two marks (or two for one mark): atmosphere, soil, groundwater/water table, lakes, river water, surface store/surface depression, snow, water tanks/water butts [2 marks].

Either a systems diagram or a pictorial image of a drainage basin is acceptable.

Award up to a maximum of [3 marks] if there is no diagram.

b.

Responses should show an understanding of salinization and its effects. Salinization is widespread in arid and semi-arid environments where groundwater extraction in coastal areas leads to saline incursion; salt water drawn upwards by capillary action results in salt enrichment of the soil/surface. Irrigation is another cause as, over time, levels of salt build up through repeated watering – leaching of the salts by flooding can lower water quality in rivers. Local geology can also play an important role in some contexts. Salinization damages livelihoods for farmers by limiting agriculture/reducing yields.

As the counter-argument, responses could also examine the impacts of agro-chemicals, sedimentation due to increased run-off, the effects of animal wastes, groundwater pollution and eutrophication of rivers, streams, lakes and/or wetlands where relevant. (Not all of these are required.)

Good answers may question who or what is damaged (land, incomes, ecosystems, local businesses), and should recognize it is a more serious concern in some parts of the world than in others.

Responses that are mainly descriptive and/or look only at salinization should not progress above band D.

At bands E and F responses should discuss the relative importance of at least one other agricultural impact on water quality. At band F there should be a well balanced evaluation.

Marks should be allocated according to the markbands.

c.

Question

(i) Define the term stream discharge.

(ii) State two river transport processes and outline how each process operates.

[5]
a.

Explain how hydrographs can be used to forecast and manage flooding.[5]

b.

Examine the possible impacts of the mismanagement of groundwater resources.[10]

c.
▶️Answer/Explanation

Markscheme

(i) The rate of stream/river flow/the volume/amount of water passing a point per unit of time (may specify hours/days – any unit of time is acceptable). Must have time.

(ii) Suspension, solution, saltation, traction, flotation. 

In each case award [1] for naming the process and [1] for some specific detail of the process eg may quantify the particle size (accept “large” or “small”), rock type, chemical processes, or use specialist vocabulary.

For example, award [2] for “Some material is carried in solution, such as material dissolved by carbonation” or “suspension is when small particles are carried in the water”.

Do not award more than [1] for an outline that does no more than define the terms (“suspension is when particles are carried in the water” or “solution is when the load is dissolved in the water”).

a.

Award [1] for the description of a hydrograph (drawn, stated or implied), for example “the hydrograph shows response of a river/stream to a precipitation event over time”.

Award [1] for each explanation of how a hydrograph is used to help with flood management/warning. Award additional marks for any development that uses specialist knowledge of hydrographs and/or floods. There may be other valid approaches and these should be credited. Answers may focus on ideas of “archive” hydrographs, “live” hydrographs (using GIS etc), or both.

For example:

  • historical hydrographs can be used as models for future flooding [1], allowing estimate of time lag to peak discharge to be made [1] which provides vital information for evacuation times [1] or provides guide to extent of possible flooding/areas at risk [1]
  • knowledge of rural and urban hydrographs helps us know what might happen in particular locations [1] because urban hydrographs are flashy [1]
  • discharge prior to rainfall event shown on hydrograph [1] shows how much/little rain is needed before bankfull discharge is reached [1]
  • return periods for high-magnitude floods [1] can be estimated eg one in a hundred year events [1] which may influence land-use zoning [1] and flood protection schemes eg size of levees [1]
  • credit other valid points not covered by the markscheme.
b.

Groundwater management may comprise over-abstraction or pollution, either of which may constitute unsustainable management depending on the scale or rate of the change. The focus may be on agriculture and groundwater pollution and may make use of a detailed local case study.

The impacts could be physical (subsidence, ecosystem damage), human (dwindling supplies, conflicts and possible attempts at resolution either locally or internationally eg transboundary aquifers). Mismanagement may also comprise distribution inequities or losses due to inefficient storage and transfer technology.

An entirely physical or human answer can be awarded full marks if it covers a range of (at least three) well-developed impacts.

Good answers may be carefully structured around different types of impact (either for processes, people or ecosystems), or may examine the temporal and/or spatial extent of any impacts. Another approach might be to examine different kinds of mismanagement, or contrasting views of user groups about what constitutes mismanagement (may use concept of sustainable development).

For band D, expect some description of some problems related to water quality and/or quantity.

At band E, expect either more detailed explanation of some impacts or an examination of the meaning of “mismanagement” (eg unsustainability).

At band F expect both of these elements.

There may be other approaches and these should be credited.

Marks should be allocated according to the markbands.

c.

Examiners report

(i) Many candidates did not give a full definition of “stream discharge”, omitting reference to time/cumecs.

(ii) Most candidates correctly named the river transport processes, but often failed to give descriptive detail to gain full marks.

a.

Most candidates understood the concept of a hydrograph, but were often let down by the explanation of how hydrographs might be used to forecast and manage flooding. There were some very good sketches of hydrographs, although annotations would have helped answer the question more succinctly.

b.

Most candidates were able to describe groundwater resources and outline some impacts of mismanagement. Many, however, were unable to develop their explanation of why mismanagement had occurred. The Aral Sea is not really considered to be a groundwater store; those that used this example told the story of mismanagement rather than focusing on the question. The very strongest responses used case studies with factual detail and figures illustrating the costs of abuse of groundwater resources to society and the environment.

c.
Scroll to Top