IBDP Geography -Option D -1. Geophysical systems – IB style Questions HLSL Paper 1

Question

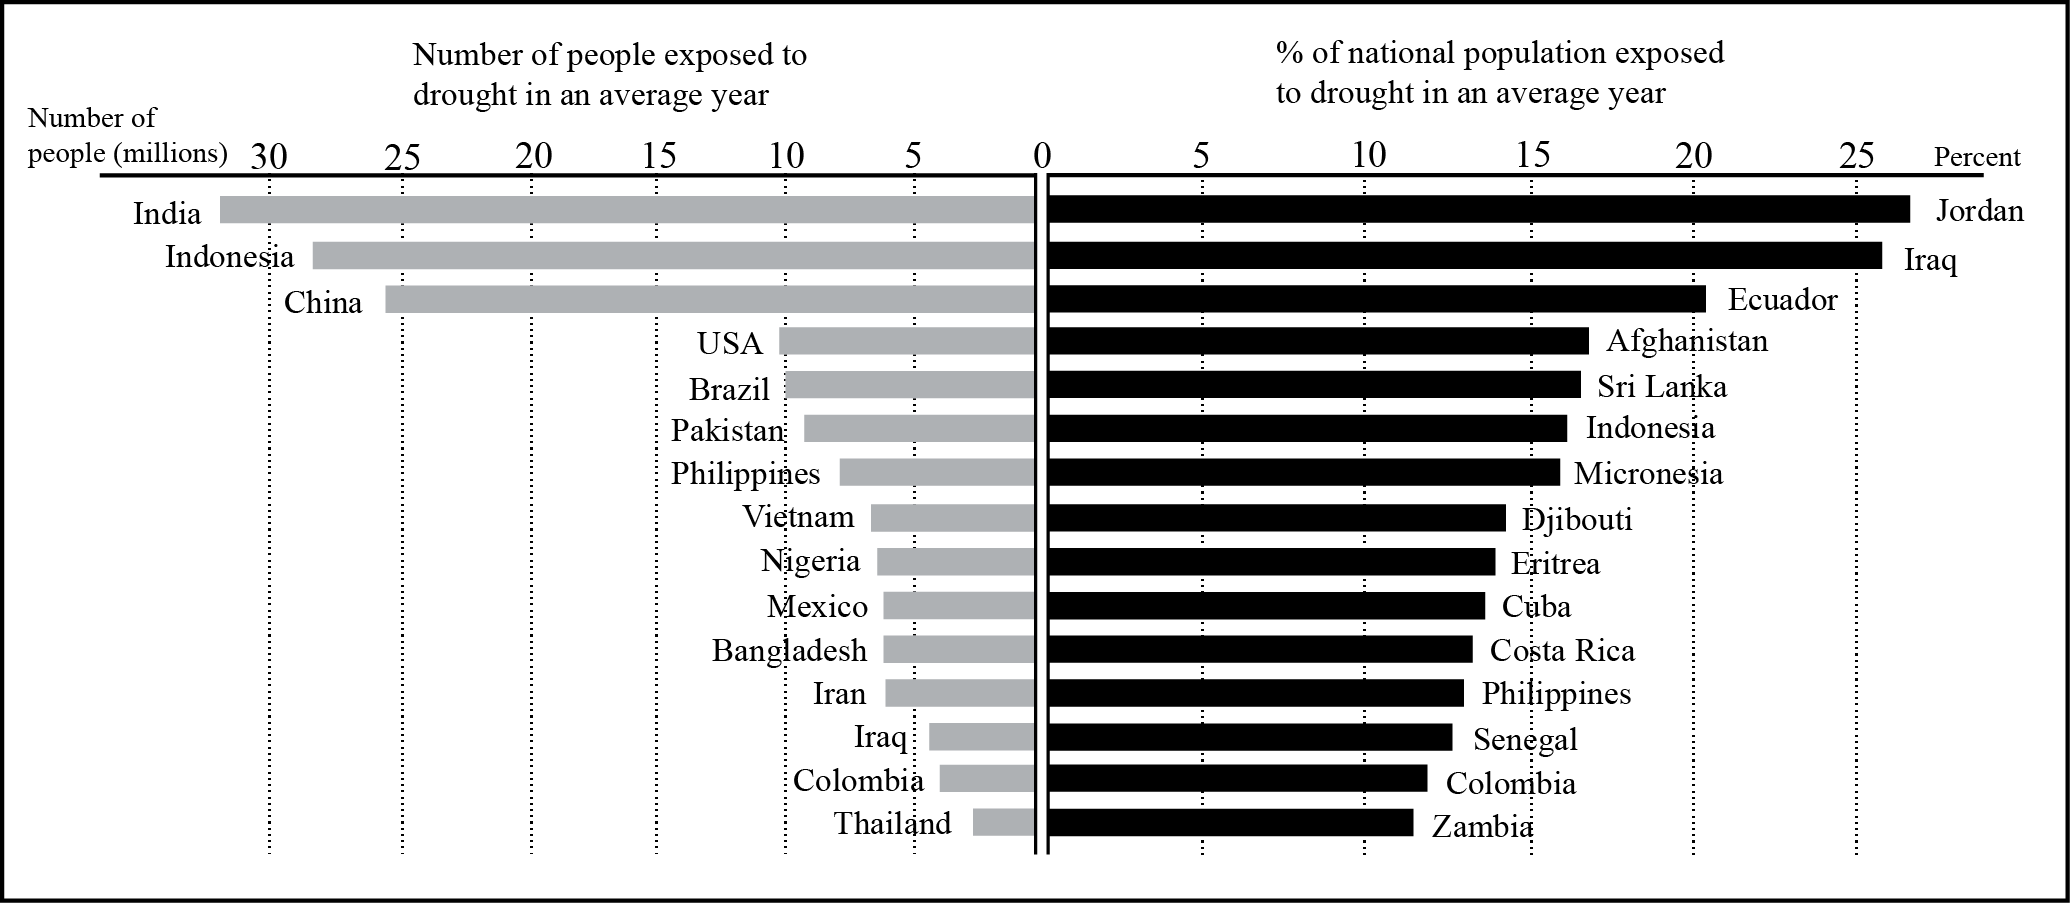
The graph shows the number of people, and the percentage of the total population, exposed to drought in different countries in an average year.

Briefly describe any two distinct patterns shown by the data on the graph.[2+2]

a.

Explain the reasons for the occurrence and severity of a specific drought event that you have studied.[6]

b.

Referring to examples, examine why the geographic impacts of disasters vary in space and time.[10]

c.
▶️Answer/Explanation

Markscheme

For each pattern, award 2 marks for its brief description, including quantification.

The graph reveals several patterns. The number of people exposed to drought in an average year tends to be higher in more populous countries such as India, Indonesia and China. The countries where the highest percentages of national population are exposed to drought in any given year tend to be relatively small in both population and in area, though Indonesia is a clear exception. Any two distinct valid patterns should be credited.

a.

Award 1 mark for the identification of when and where a specific drought event occurred and a further 1 mark for a description of its severity. The remaining 4 marks should be reserved for the explanation of why the event occurred and for its severity. For 4 marks both must be explained, though it is not necessary for both to be explained in equal detail.

Responses that do not focus on a specific drought event may not be awarded more than 3 marks.

b.

There are many factors explaining why the impacts of disasters vary in space and time, and candidates are expected to include a variety of ideas in their answers.

The impacts of disasters depend on the type of hazard event leading to the disaster. For example, a drought has very different impacts, in both time and space, to a volcanic eruption. The impacts of disasters are not only determined by the characteristics of the hazard event, but also by the characteristics of the population and economic activity in the area concerned. The vulnerability of the population varies spatially, and with time. Impacts will be reduced if well-rehearsed response plans work effectively. Conversely, impacts may be increased if the first signs of an upcoming disaster are ignored. For a disaster of any given magnitude, it is often argued that more lives may be lost, but that the value of property damage will be less, in economically less developed nations than in more developed nations.

Other valid ideas should also be credited.

It is not necessary for variations in space and time to be treated equally. Answers examining both aspects of the question in some detail are likely to be credited at bands E/F. Examples are a specific requirement of the question and are required to access band D and above.

Marks should be allocated according to the markbands.

c.

Question

(i) Define the term disaster.

(ii) Outline two long-term actions a community can take to reduce the economic impact of hurricanes.[5]

a.

Explain the causes of one named human-induced hazard event.[5]

b.

Examine the reasons why people continue to live in areas that have been affected by severe drought hazard events.[10]

c.
▶️Answer/Explanation

Markscheme

(i) A major hazard event that needs outside help.

(ii) In each case award [1] for a basic way to reduce economic losses and [1] for some development (using knowledge of hurricanes, economics, planning, governance etc) or the applied use of an example, such as measures introduced after a named hurricane.

  • Strengthen buildings [1] and may have details of structures or where this was done [1].
  • Purchase insurance [1] and may explain how policies operate to reduce costs for individuals [1].
  • Land-use planning [1] and may give details of areas to be avoided eg low lying land with flood risk [1].
  • Improved warning systems [1], may suggest details, or describes a place where this was done [1].
a.

Award [1] for correctly identifying a named human-induced (human error) hazard event such as the 2010 major industrial waste spill in Hungary, the Chernobyl nuclear power incident, the Gulf of Mexico oil spill (does not need to state year).

Award up to [4] for the explanation, for example:

  • human error in design/operation identified [1] and may provide further explanation of this [1]
  • provides specific details of the hazardous material provided eg names gas, radioactive isotopes [1]
  • provides detail of how physical processes eg ocean currents, wind, led to a larger area or particular areas being affected [1] and may give examples of areas [1]
  • shows why the event constituted a hazard risk to humans eg oil affected populated areas of Florida [1]
  • credit other valid explanatory material (on the cause of the event/why it constitutes a hazard).

“High tech” problems triggered by a natural hazard eg Fukushima 2011 can be awarded up to [3] only.

b.

Drought should ideally be understood as below average/expected/normal precipitation (and not simply arid environments). The answer should ideally be related to the global distribution of actual drought, including named areas (may consider irregularities of mid-latitude air mass movements; cyclic shifts; El Niño and La Niña).

Answers that deal with naturally arid regions (that are not necessarily subject to drought, such as normal summers in the Mediterranean) can reach band E (but not band F) if the discussion of human behaviour or adaptation is good.

Reasons might include:

  • lack of knowledge including serious secondary risks (wildfires)
  • lack of economic options/poverty/inertia/fatalism
  • political issues eg refugees forced into drought-stricken areas
  • too trusting of insurance/governance
  • resilient/adaptive behaviour eg water storage, deep wells, crop diversification, temporary migration etc.

Good answers may examine in a structured way how reasons may vary according to the type of geographical area (level of development, scale, physical location eg continentality, geopolitics eg conflict zones). Another approach might be to examine the timescale over which drought events have occurred or knowledge of their recurrence intervals.

For band D, expect some description of a drought and/or some reasons why people do not relocate from hazardous areas in general.

At band E, expect either more detailed explanation of reasons why people remain in drought-prone areas or a structured examination of different kinds of area/context for drought.

At band F expect both of these elements.

Marks should be allocated according to the markbands.

c.

Examiners report

(i) Definitions had to refer to the need for outside help to gain the mark.

(ii) When referring to the long-term actions, each point needed to be further developed to gain the additional mark. For example, candidates mentioned land-use planning but answers were generalized without development.

a.

The question refers to a human-induced hazard event, such as Chernobyl or a major oil spill. Note that Fukushima is a problem triggered by a natural hazard and is not really relevant. Many described the event and discussed the impacts rather than examining the causes.

b.

This was generally well answered. The best candidates used comparative case studies from, for example, Australia and a Sahel country.

c.

Question

Referring to either earthquakes or volcanoes, briefly outline:

(i) one scale used to measure the magnitude of the hazard event; 

(ii) why some hazard events are categorized as disasters.[4]

a.

Referring to either earthquakes or volcanoes, briefly explain their occurrence:

(i) at a destructive (convergent) plate margin; 

(ii) in areas other than along a plate margin.[6]

b.

Discuss why some hazard events are easier to predict than others.[10]

c.
▶️Answer/Explanation

Markscheme

(i) 

  • identifies a scale [1]
  • provides detail of the scale [1].

Example: (earthquakes) The Richter scale [1] gives values for magnitude on a logarithmic scale [1].

Accept other valid details about the scale.

(ii) 

  • outside help is needed to deal with the disruption
  • provides further detail or an example.
a.

(i) Earthquakes:

  • two plates move towards each other [1] and one is subducted/sinks due to density [1]
  • this results in friction/tension that generates earthquakes [1] may give additional details eg deep focus events to a depth of 700 km [1]
  • provides a clear diagram in support [1].

Volcanoes:

  • two plates move towards each other [1] and one is subducted/sinks due to density [1]
  • this results in melting/partial melting to produce magma [1] may give additional details eg viscous lava resulting in explosive eruptions [1]
  • provides a clear diagram in support [1].

(ii) Earthquakes:

  • transform/minor faults [1] run hundreds of kilometres perpendicular to plate boundaries [1] may give example [1]
  • may occur at volcanic hotspots [1] due to thin plate/highly active plume [1] may give example [1]
  • human-induced hazards eg reservoir construction [1], mining or fracking [1] may give example [1]
  • provides a clear diagram in support [1].

Volcanoes:

  • may occur at volcanic hotspots [1] due to thin plate/highly active plume [1] may give example [1]
  • volcanoes at destructive boundaries may be some distance from actual margin due to the angle of subduction [1] may give details [1]
  • provides a clear diagram in support [1].
b.

The most likely framework will be to explain, in turn, some combination of different types of hazard events: hurricanes, tectonic hazards, droughts and human-induced (technological) hazards. Two named types must be discussed in some depth for the award of full marks.

Credit should be given for the use of an alternative conceptual framework, for instance looking at the probability of high-impact/high-magnitude events as opposed to low-impact events with different recurrence intervals. Another approach is to look at spatial and temporal probabilities. We may predict where, but not when (San Andreas fault); or we may predict when, but not where (next year’s hurricane season).

Good answers might critically discuss:

  • the general predictability of hurricane activity but lack of ability to predict actual paths/intensities/landfall
  • how our ability to predict in the short-term is actually improving/dynamic, eg analysis of earthquake “swarms” or GIS applied to detect magma chamber expansion
  • the varying capabilities of countries at differing levels of development and their ability to predict/anticipate hazards
  • unpredictability of human-induced hazards.

Only credit answers that refer to one or more of the four types of hazard included in the syllabus.

At band D, expect answers which describe some basic reasons for differences in our ability to predict where/when different hazards may strike.

At band E, expect either more detailed explanation of our varying ability to predict where/when different types of hazard will strike or some critical discussion of the statement

At band F, expect both.

Marks should be allocated according to the markbands.

c.
Scroll to Top