▶️ Answer/Explanation
a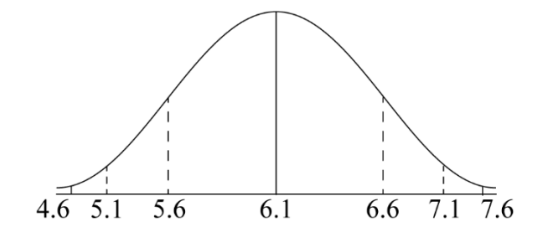
Explanation:
A normal distribution curve with mean 6.1 kg and standard deviation 0.5 kg is sketched.
Result:
Diagram as shown
b
\( X \sim N(6.1, 0.5^2) \), find \( P(5.5 < X < 6.5) \).
Standardize: \( Z = \frac{X – 6.1}{0.5} \),
\( P(5.5 < X < 6.5) = P\left(\frac{5.5 – 6.1}{0.5} < Z < \frac{6.5 – 6.1}{0.5}\right) = P(-1.2 < Z < 0.8) \).
Using standard normal tables: \( P(Z < 0.8) \approx 0.7881 \), \( P(Z < -1.2) \approx 0.1151 \),
so \( P(-1.2 < Z < 0.8) = 0.7881 – 0.1151 = 0.6730 \).
Explanation:
Convert to standard normal distribution and use z-table values.
Result:
0.673 (0.673074…)
c
\( P(X < 5.3) = P\left(Z < \frac{5.3 – 6.1}{0.5}\right) = P(Z < -1.6) \approx 0.0548 \).
Expected number = \( 0.0548 × 80 \approx 4.384 \).
Explanation:
Calculate the probability using the z-table and multiply by the sample size.
Result:
4.38 (4.38393…)
d (i)
\( Y \sim N(4.5, 0.45^2) \), find \( P(Y > 4.62) \).
Standardize: \( Z = \frac{Y – 4.5}{0.45} \),
\( P(Y > 4.62) = P\left(Z > \frac{4.62 – 4.5}{0.45}\right) = P(Z > 0.2667) \approx 1 – P(Z < 0.27) \approx 1 – 0.6052 = 0.3948 \).
Binomial probability: \( P(\text{exactly 1 out of 10}) = \binom{10}{1} × (0.3948)^1 × (1 – 0.3948)^9 \),
\( \binom{10}{1} = 10 \), \( (1 – 0.3948)^9 \approx 0.6052^9 \approx 0.04297 \),
so \( 10 × 0.3948 × 0.04297 \approx 0.0430 \).
Explanation:
Use normal distribution for \( P(Y > 4.62) \) and binomial for exactly one success.
Result:
0.0430 (0.0429664…)
d (ii)
Variance of \( N \sim \text{Binomial}(10, 0.3948) \) is \( np(1 – p) \),
\( n = 10 \), \( p = 0.3948 \), \( 1 – p = 0.6052 \),
variance = \( 10 × 0.3948 × 0.6052 \approx 2.389 \).
Explanation:
Apply the binomial variance formula.
Result:
2.39 (2.38946…)
e
\( P(F \cap (W > 4.7)) = 0.5 × P(Y > 4.7) \), where \( P(Y > 4.7) \approx 1 – P(Z < \frac{4.7 – 4.5}{0.45}) \approx 1 – P(Z < 0.4444) \approx 1 – 0.6716 = 0.3284 \),
so \( P(F \cap (W > 4.7)) = 0.5 × 0.3284 = 0.1642 \).
Total \( P(W > 4.7) = 0.5 × P(X > 4.7) + 0.5 × P(Y > 4.7) \),
\( P(X > 4.7) \approx 1 – P(Z < \frac{4.7 – 6.1}{0.5}) \approx 1 – P(Z < -2.8) \approx 1 – 0.0026 = 0.9974 \),
so \( P(W > 4.7) = 0.5 × 0.9974 + 0.5 × 0.3284 \approx 0.6629 \).
\( P(F | W > 4.7) = \frac{0.1642}{0.6629} \approx 0.2477 \).
Explanation:
Use conditional probability with normal distributions for male and female weights.
Result:
0.248 (0.247669…)