▶️ Answer/Explanation
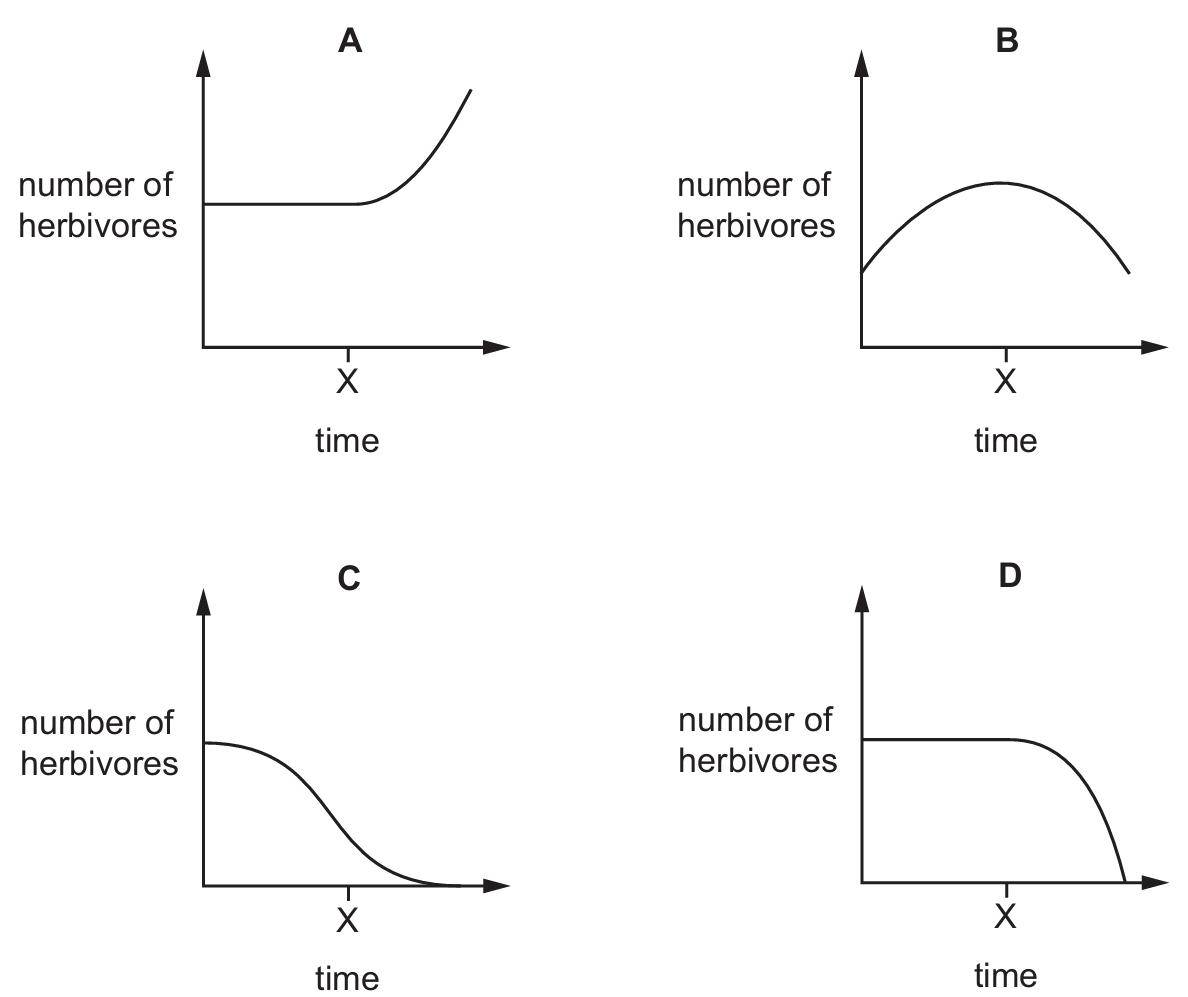
In an ecosystem, carnivores act as predators that control the population size of herbivores through predation. Before time $X$, the herbivore population is shown in a state of equilibrium, likely maintained by this predatory pressure. When carnivores are removed at time $X$, the primary limiting factor on the herbivore population is eliminated. Without predators to hunt them, the survival rate of herbivores increases significantly, leading to a rapid, exponential rise in their numbers as they continue to reproduce. Graph A correctly illustrates this stable population followed by a sharp upward trend immediately after the removal of the carnivores.
✅ Answer: (A)
✅ Answer: (A)
▶️ Answer/Explanation
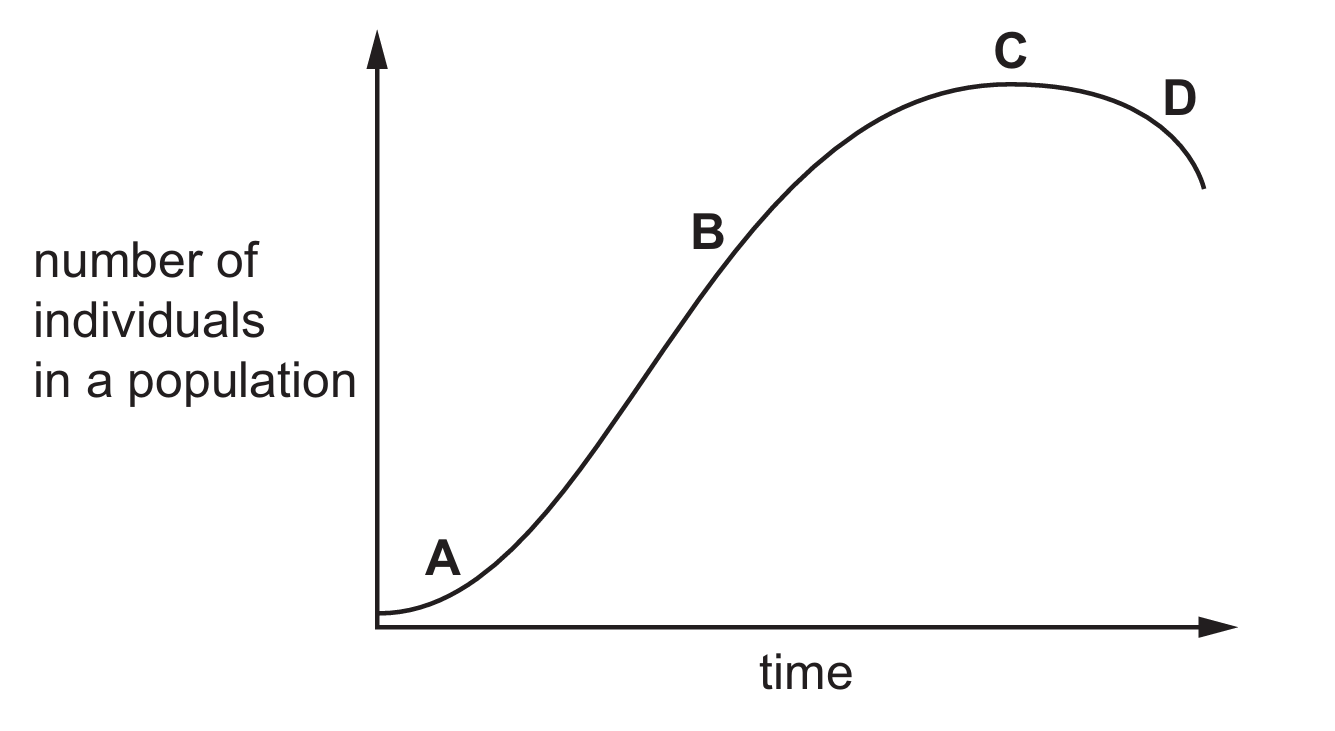
The lag phase is the initial period of a sigmoid growth curve where the population size is small and the rate of increase is very slow as organisms adapt to their new environment. In the provided diagram, this corresponds to point A. Following this is the log (exponential) phase at B, the stationary phase at C where birth and death rates equalize, and finally the decline phase at D. Because the population is just beginning to establish itself at the start of the timeline, point A is the only correct identification of the lag phase.
✅ Answer: (A)
✅ Answer: (A)
▶️ Answer/Explanation
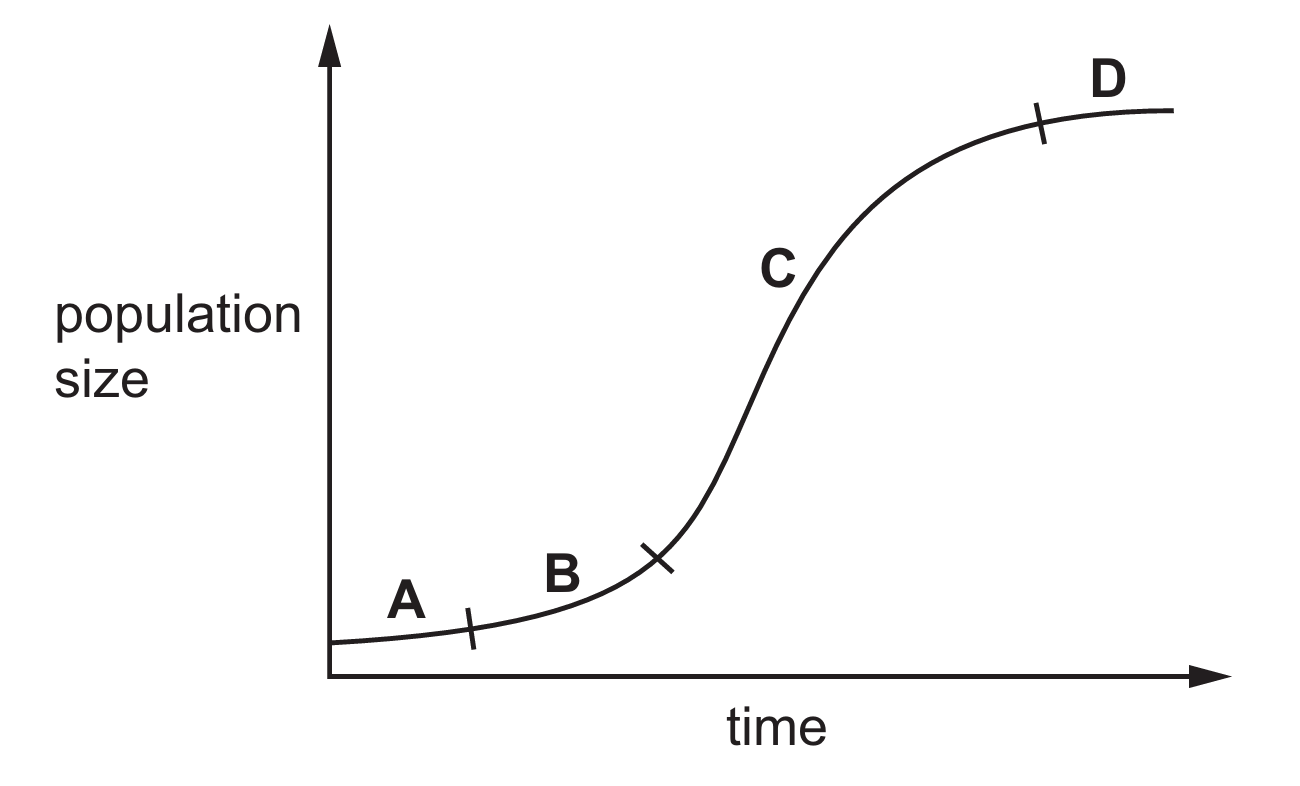
The graph illustrates a typical sigmoid (S-shaped) growth curve. In the earlier stages ($A$, $B$, and $C$), the population is either establishing itself or growing rapidly because resources are relatively abundant. However, as the population reaches part D, it enters the stationary phase. At this point, the birth rate equals the death rate because the environment has reached its carrying capacity. This stabilization occurs specifically because essential resources like food, water, and space become limited, preventing further net growth.
✅ Answer: (D)
✅ Answer: (D)