Question
The table shows the average monthly temperature (°C) for Fairbanks, Alaska.

(a) Find
(i) the difference between the highest and the lowest temperatures,
Answer/Explanation
Ans: 40.3 °C
(ii) the median.
Answer/Explanation
Ans: −3.3 °C
(b) A month is chosen at random from the table.
Find the probability that its average temperature is below zero.
Answer/Explanation
Ans: \(\frac{7}{12}oe\) isw
Question
The table shows how 45 students each travel to college.

This information can be displayed in a pie chart.
(a) Show that the sector angle for students who walk is 160°.
(b) Calculate the sector angle for students who travel by bus.
(c) Complete the pie chart and label the sectors.

Answer/Explanation
(a)\(\frac{20}{45}\times 360[=160]\)
(b) 144
(c)Pie chart with at least 2 correct
sectors and at least 2 sectors
correctly labelled.
Question
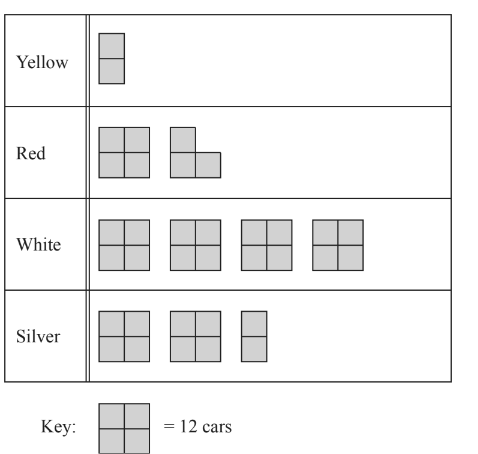
The pictogram shows the number of different coloured cars a garage sells in a month.

Work out how many more white cars than red cars the garage sells
Answer/Explanation
.
27
