(a) Students solve a puzzle by making guesses.
The table shows the number of guesses that each of 40 students make.
| Number of guesses | 1 | 2 | 3 | 4 | 5 | 6 |
|---|---|---|---|---|---|---|
| Frequency | 2 | 4 | 8 | 7 | 12 | 7 |
(i) Find the mode.
(ii) Calculate the mean.
(b) In another puzzle each student gets a score. These are the scores for 12 students:
17 21 24 32 27 11
26 18 10 29 14 24
(i) Complete the stem-and-leaf diagram for these scores.

(ii) Find the median.
(c) A different puzzle has three outcomes: win, draw or lose. The table shows the outcomes for 30 students:
| Outcome | Win | Draw | Lose |
|---|---|---|---|
| Frequency | 9 | 14 | 7 |
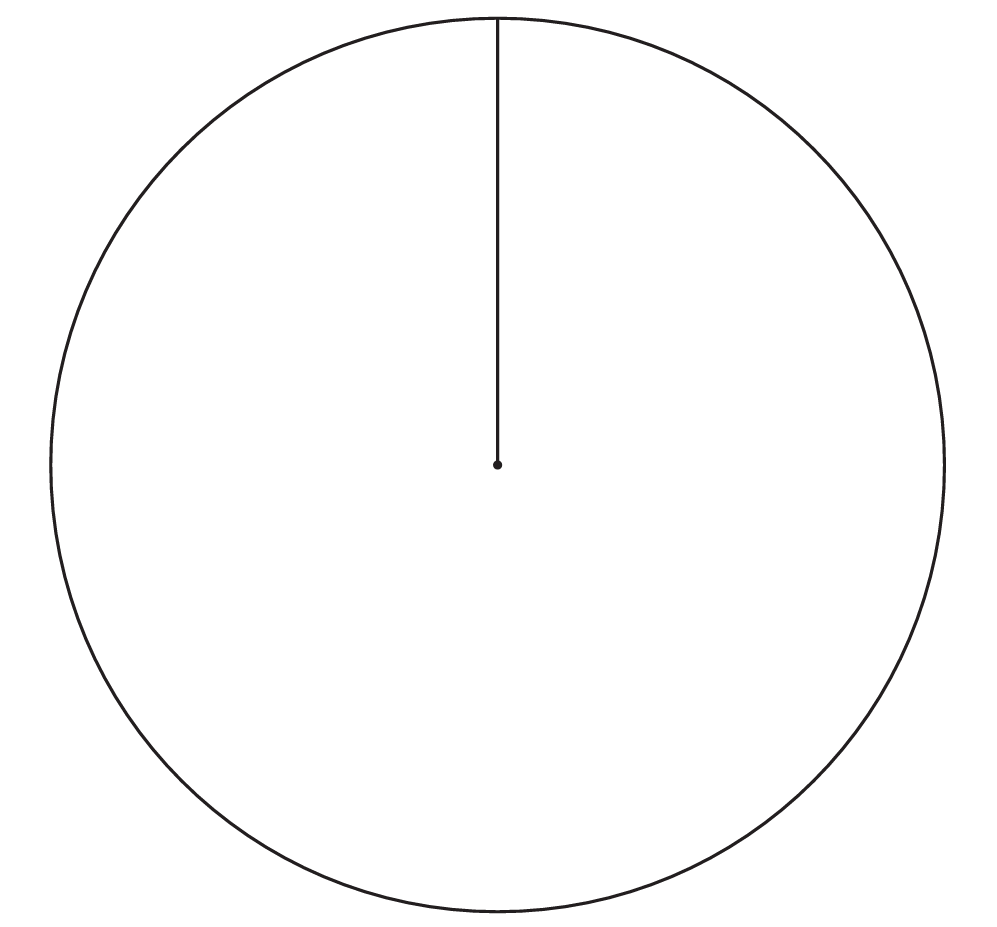
Complete the pie chart to show this information.
▶️ Answer/Explanation
(a)(i) Ans: 5
The mode is the number with highest frequency, which is 5 (frequency 12).
(a)(ii) Ans: 4.1
Mean = (1×2 + 2×4 + 3×8 + 4×7 + 5×12 + 6×7) ÷ 40 = 164 ÷ 40 = 4.1
(b)(i) Ans:
1 | 0 1 4 7 8
2 | 1 4 4 6 7 9
3 | 2
Key: 1 | 7 represents 17
(b)(ii) Ans: 22.5
Ordered scores: 10,11,14,17,18,21,24,24,26,27,29,32. Median = average of 6th and 7th values = (21+24)/2 = 22.5
(c) Ans:
Pie chart angles: Win = (9/30)×360° = 108°, Draw = (14/30)×360° = 168°, Lose = (7/30)×360° = 84°
(a) Zena records the number of letters she posts on each of 12 days.
3 7 3 8 7 1 0 6 5 1 7 2
(i) Write down the mode.
(ii) Find the median.
(b) Zena posts 6 parcels.
- The lightest parcel has a mass of 4.6 kg.
- The heaviest parcel has a mass of 6.2 kg.
- The other 4 parcels have a mean mass of 5.01 kg.
Calculate the mean mass of the 6 parcels.
(c) Zena pays 105 euros to post a parcel.
The exchange rate is $1 = 0.84 euros.
Work out the cost in dollars to post the parcel.
(d) The cost to post a box increases from $22.68 to $44.
Work out the percentage increase in the cost.
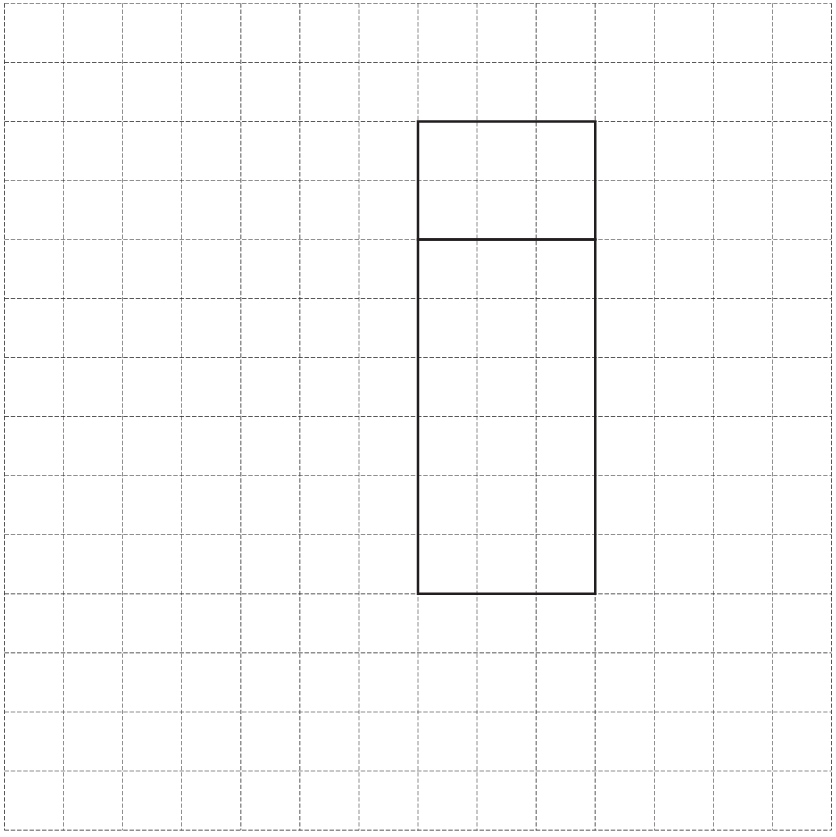
(e) The diagram shows a parcel in the shape of a cuboid.

(i) Complete the net of the parcel on the 1 cm² grid.
Two faces have been drawn for you.
(ii) Find the volume of the parcel.
▶️ Answer/Explanation
(a)(i) Ans: 7
The mode is the most frequent number in the list. The number 7 appears three times, more than any other number.
(a)(ii) Ans: 4
First arrange the numbers in order: 0,1,1,2,3,3,5,6,7,7,7,8. The median is the average of the 6th and 7th numbers (3 and 5), which is 4.
(b) Ans: 5.14 kg
Total mass of 4 parcels = 4 × 5.01 = 20.04 kg. Total for all 6 parcels = 20.04 + 4.6 + 6.2 = 30.84 kg. Mean = 30.84 ÷ 6 = 5.14 kg.
(c) Ans: $125
Divide euros by exchange rate: 105 ÷ 0.84 = 125 dollars.
(d) Ans: 94%
Increase = $44 – $22.68 = $21.32. Percentage increase = (21.32 ÷ 22.68) × 100 ≈ 94%.
(e)(i) Ans: The net should show all six faces of the cuboid arranged flat, with dimensions 3cm×6cm, 3cm×2cm, and 6cm×2cm.
(e)(ii) Ans: 36 cm³
Volume = length × width × height = 3 × 6 × 2 = 36 cm³.