Question
Pedro is on a cruise ship.
(a) The ship has a climbing wall.
These are the number of attempts that each of 30 people made at climbing the wall.
29 27 11 3 12 4 29 9 16 17 30 29 38 36 18
2 15 24 36 3 33 26 21 9 38 4 28 23 19 27
(i) Find the range.
(ii) Complete the frequency table.
You may use the tally column to help you.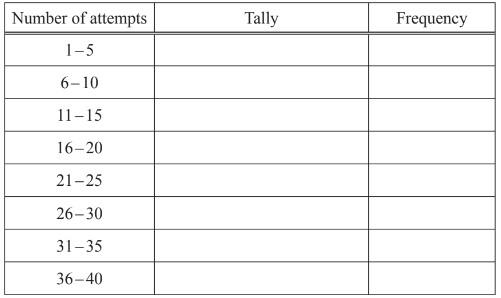
(iii) Draw a bar chart to show this information.
Complete the scale on the frequency axis.
(iv) Write down the modal group.
(b) Pedro left the ship in Cadiz at 0845.
He returned to the ship at 1610.
Find how long Pedro was in Cadiz.
(c) Exchange Rate
$1 = €1.428
(i) Pedro changed $167 into euros (€).
Calculate how many euros Pedro received.
Give your answer correct to 2 decimal places.
(ii) Later, Pedro changed €107.10 back into dollars ($) using the same exchange rate.
Calculate how many dollars Pedro received.
Answer/Explanation
Answer:
(a) (i) 36 cao
(ii) 5, 2, 3, 4, 3, 8, 1, 4
(iii) fully correct bar chart
(iv) 26 – 30 cao
(b) 7 (hours) 25 ( minutes) cao
(c) (i) 238.48
(ii) 75
Question
The table shows a summary of the types of employment for 90 people.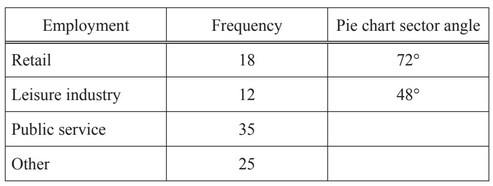
(a) (i) Complete the table.
(ii) Complete the pie chart and label the sectors.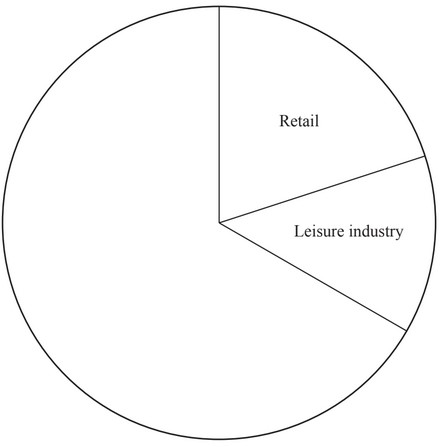
(b) Here are the ages of the people working in the leisure industry.
16 17 19 23 23 24 27 31 33 40 45 56
(i) Work out the range.
(ii) Calculate the mean.
(iii) Sabrina wants to interview someone working in the leisure industry.
She chooses one person at random.
Write down the probability that the person chosen is under 30 years old.
Answer/Explanation
Answer:
(a) (i) 140
(ii) 100
(ii) correct labelled pie chart
(b) (i) 40
(ii) 29.5
(iii) \(\frac{7}{12}\) oe
Question
(a) One day a survey is taken of the ages of 120 children at a fairground.
The results are shown in the frequency table.
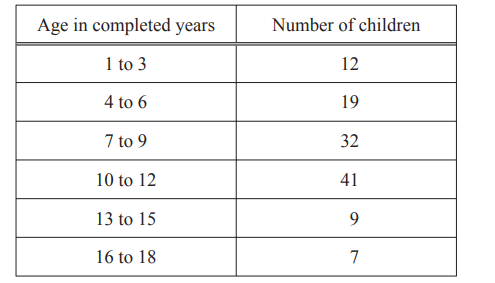
(i) On the grid, draw a bar chart for this data.
Complete the scale on the frequency axis.
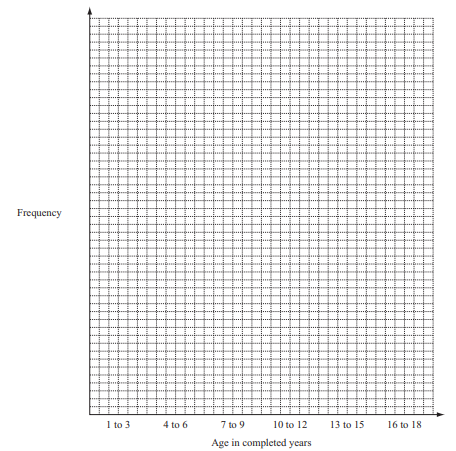
Answer/Explanation
Ans: Correct diagram with scale
(ii) What is the modal age group?
Answer/Explanation
Ans: 10 to 12 cao
(iii) One of the 120 children is chosen at random.
Write down the probability that the child is aged 4 to 6.
Answer/Explanation
Ans: \(\frac{19}{120}\) or 0.158[3….] or 15.8[3……]%
(b) Lalia says the probability of taking a yellow bead from a bag containing yellow beads and black beads is \(\frac{7}{5}.\)
Explain why \(\frac{7}{5}\) cannot be a correct probability
Answer/Explanation
Ans: Probability must be between 0 and 1 oe
(c) Another bag contains 9 green marbles and 11 red marbles.
A marble is taken at random.
Write down the probability that the marble is
(i) green,
Answer/Explanation
Ans: \(\frac{9}{20}\) or 0.45 or 45%
(ii) blue.
Answer/Explanation
Ans: 0 oe
Question
12 athletes took part in the 100 metres race.
11 of these athletes also took part in the long jump.
The times and distances, each measured correct to 3 signifi cant fi gures, for these athletes are shown in the
table.

(a) The scatter diagram shows the times and distances for athletes B to H.
(i) Plot the times and distances for athletes I, J, K and L.
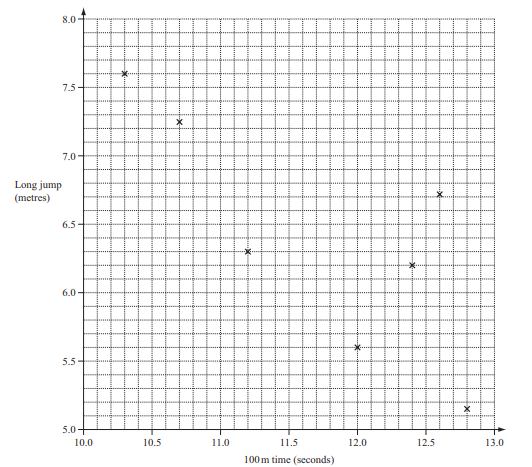
Answer/Explanation
Ans:
(ii) On the scatter diagram, draw a line of best fi t.
Answer/Explanation
Ans:
(iii) Athlete A did not take part in the long jump.
Use your line of best fi t to estimate a long jump distance for athlete A.
Answer/Explanation
Ans:
(iv) What type of correlation is shown on the scatter diagram?
Answer/Explanation
Ans:
(v) Describe in words the relationship between the time for 100 metres and the distance in the long jump.
Answer/Explanation
Ans:
(b) Use the table of times and distances to work out
(i) the mean of the 100 metres times,
Answer/Explanation
Ans:
(ii) the percentage of athletes who ran 100 metres in less than 11.5 seconds,
Answer/Explanation
Ans:
(iii) the range of the distances jumped by the 11 athletes, B to L.
Answer/Explanation
Ans:
Question
Denzil grows tomatoes. He selects a random sample of 25 tomatoes.
The mass of each tomato, to the nearest 5 grams, is shown below.
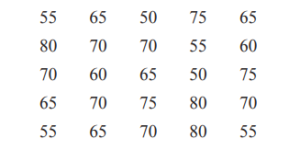
(a) (i) Complete the frequency table.
You may use the tally column to help you.
| Mass (grams) | Tally | Frequency |
| 50 | ||
| 55 | ||
| 60 | ||
| 65 | ||
| 70 | ||
| 75 | ||
| 80 |
Answer/Explanation
Ans:
| Mass (grams) | Tally | Frequency |
| 50 | 2 | |
| 55 | 2 | |
| 60 | 4 | |
| 65 | 5 | |
| 70 | 6 | |
| 75 | 3 | |
| 80 | 3 |
(ii) Write down the mode.
Answer/Explanation
Ans: 70
(iii) Find the range.
Answer/Explanation
Ans: 30
(iv) Show that the mean mass is 66g
Answer/Explanation
Ans: ∑(Frequency, f × mass, w)
1650 ÷ 25
(b) Denzil picks 800 tomatoes.
4% of the 800 tomatoes are damaged.
How many of these tomatoes are not damaged?
Answer/Explanation
Ans: 768
(c) Denzil sells 750 of his tomatoes.
(i) The mean mass of a tomato is 66g.
Calculate the mass of the 750 tomatoes in kilograms.
Answer/Explanation
Ans: 49.5 cao
(ii) Denzil sells his tomatoes at $1.40 per kilogram.
Calculate the total amount he receives from selling all the 750 tomatoes.
Answer/Explanation
Ans: 69.3[0]
(iii) The cost of growing these tomatoes was $33.
Calculate his percentage profi t.
Answer/Explanation
Ans: 110
Question
(a) 120 children take part in an athletics competition.
(i) Complete the table to show the number of children in each group.
| Girls | Boys | Total | |
| Age 15 | 65 | ||
| Age 16 | 44 | ||
| Total | 70 | 120 |
Answer/Explanation
Ans:
| Girls | Boys | Total | |
| Age 15 | 26 | 39 | 65 |
| Age 16 | 44 | 11 | 55 |
| Total | 70 | 50 | 120 |
(ii) One child is selected at random.
Find the probability that it is a girl aged 16.
Give your answer as a fraction in its lowest terms.
Answer/Explanation
Ans: \(\frac{11}{30}oe\)
(iii) Write down the ratio number of girls aged 15: number of boys aged 15.
Give your answer in its simplest form.
Answer/Explanation
Ans: 2 : 3 cao
(b) Here are the distances, in metres, recorded in the boys’ shot putt.
9.23 6.21 9.86 8.64 7.15 7.72 9.01 7.34 6.53 6.89
(i) Find the median.
Answer/Explanation
Ans: 7.53 m
(ii) Find the range.
Answer/Explanation
Ans: 3.65 m
(iii) Another boy was a late entry to the competition.
After his attempt, the range increased by 20cm.
Work out the two possible distances of his attempt.
Answer/Explanation
Ans: 10.06 m or 6.01 m
Question
The Patel family flies from their home town, H, to Kiruna, K, in Lapland.
(a) The scale drawing shows their journey.
The scale is 1 centimetre represents 40 kilometres.
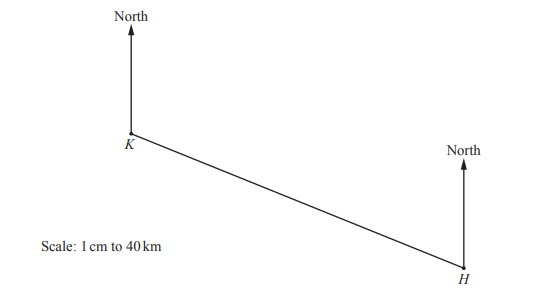
(i) Measure the bearing of K from H.
Answer/Explanation
Ans: 292
(ii) Work out the distance in kilometres from H to K.
Answer/Explanation
Ans: 380 km
(iii) The average speed of the plane is 450km/h.
Find the average speed in m/s.
Answer/Explanation
Ans: 125 m/s
(b) The probability that the plane arrives on time is 0.15 .
(i) Write down the probability that the plane does not arrive on time.
Answer/Explanation
Ans: 0.85
(ii) Every year there are 240 flights from H to K.
Calculate the expected number of flights that arrive on time.
Answer/Explanation
Ans: 36
(c) The Patel family has six suitcases.
The number of items in each suitcase is shown below.
15 16 16 18 19 21
(i) Find the range.
Answer/Explanation
Ans: 6
(ii) Write down the mode.
Answer/Explanation
Ans: 16
(iii) Work out the median.
Answer/Explanation
Ans: 17
(iv) Calculate the mean.
Answer/Explanation
Ans: 17.5
(v) Find the probability that a suitcase chosen at random has more than 18 items.
Answer/Explanation
Ans: \(\frac{2}{6}oe\)
(d) Mr Patel buys a bag of sweets.
The bag of sweets costs $3.25 .
(i) Calculate the cost of the sweets in euros (€) when the exchange rate is €1 = $1.24 .
Answer/Explanation
Ans: 2.62
(ii) The weight, w grams, of the bag of sweets is 250g correct to the nearest 10 g.
Complete this statement about the value of w.
Answer/Explanation
Ans: 245 ≤ w < 255
Question
Olga owns a fruit and vegetable shop.
(a) An apple weighs 70 g correct to the nearest 5g.
Complete the statement about the mass, m grams, of this apple.
Answer/Explanation
Ans: 67.5
72.5
(b) The number of strawberries in each of 12 boxes is shown below.
23 21 21 20 21 20
22 22 21 20 20 20
(i) Find the range.
Answer/Explanation
Ans: 3
(ii) Write down the mode.
Answer/Explanation
Ans: 20
(iii) Find the median.
Answer/Explanation
Ans: 21
(iv) Calculate the mean.
Answer/Explanation
Ans: 20.9 or 20.91 to 20.92
(v) Find the probability that a box chosen at random has 22 or 23 strawberries in the box.
Answer/Explanation
Ans: \(\frac{3}{12}oe\)
(c) The shop sells potatoes in bags A, B and C.
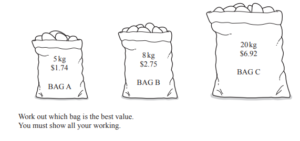
Answer/Explanation
Ans: complete correct method shown and Bag B oe
(d) The price of plums is $2.40 per kilogram.
Olga reduces this price by 35%.
Calculate the new price per kilogram.
Answer/Explanation
Ans: $ 1.56
Question
Javier went to a carnival with his friends.
(a) He played five games of darts.
These are his scores.
160 58 45 82 125
(i) Work out his mean score.
(ii) Find the range.
(b) The 5000 tickets for the carnival are different colours.
The table shows the number of tickets of each colour.
| Colour of ticket | Red | Green | Blue | Pink | White |
| Number of tickets | 370 | 560 | 1800 | 1320 | 950 |
A ticket is picked at random.
Find the probability that this ticket is Blue.
(c) Five different types of food are sold at the carnival.
Javier chooses one of these types of food.
The table shows the probability that he chooses each type of food.
| Type of food | Curry | Fries | Pasta | Burger | Salad |
| Probability | 0.15 | 0.23 | 0.4 | 0.07 |
Complete the table.
(d) Javier hires a four-seater bike.
The hire cost is $8.50 for the first hour and then $7.75 for each extra hour.
Calculate the cost of hiring the bike for 5 hours.
$ …………………………………………
(e) The table shows the number of drinks sold by one stall at the carnival.
| Drink | Number sold |
| Tea | 70 |
| Orange | 60 |
| Water | 120 |
| Coffee | 180 |
| Smoothie | 40 |
Draw a bar chart to show this information.
Complete the scale on the frequency axis.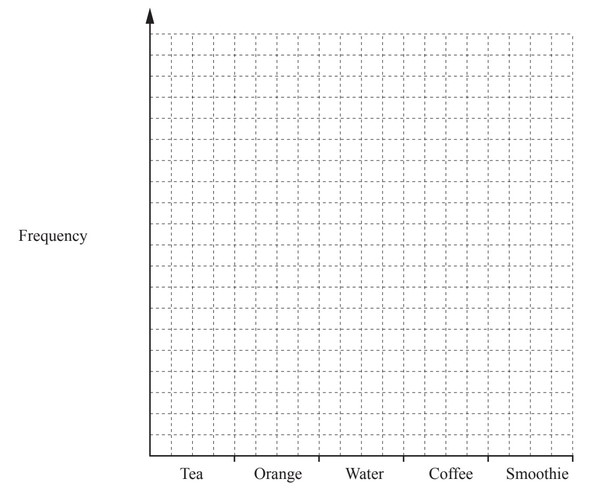
Answer/Explanation
Answer:
(a) (i) 94
(ii) 115
(b) \(\frac{1800}{5000}\) oe isw
(c) [0].15
(d) 39.5[0]
(e) Correct bar chart
Question
Joel spins a fair five-sided spinner numbered 2, 3, 4, 5 and 6.
(a) Write down the probability that the spinner lands on
(i) an odd number,
(ii) a prime number,
(iii) the number 7.
(b) Here are the results of his first 20 spins.
| Number | 2 | 3 | 4 | 5 | 6 |
| Frequency | 3 | 2 | 6 | 4 | 5 |
(i) Write down the mode.
(ii) Calculate the mean.
(iii) Joel wants to draw a pie chart to show the results in the table.
(a) Show that the sector angle for the number 2 is 54°.
(b) Find the sector angle for the number 6.
(c) Joel asks 30 students to guess the number that the spinner will next land on.
The results are shown in this pie chart.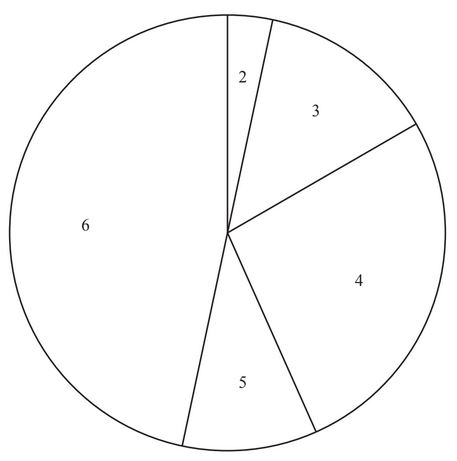
(i) The sector angle for the number 6 is 168°.
How many students guessed the number 6?
(ii) Find the percentage of the students who guessed a number less than 5.
……………………… %
(iii) Joel spins the spinner.
10% of the 30 students guessed correctly.
Which number did the spinner land on?
Answer/Explanation
Answer:
(a) (i) \(\frac{2}{5}\) oe
(ii) \(\frac{3}{5}\)oe
(iii) 0
(b) (i) 4
(ii) 4.3
(iii) (a) \(\frac{3}{20} \times 360\)
(iii) (b) 90
(c) (i) 14
(ii) 43.3
(iii) 5
Question
(a) A farmer has 45 horses and 20 cows.
(i) Write this as a ratio horses : cows.
Give your answer in its simplest form.
(ii) The farmer wants the ratio horses : cows to equal 5 : 3.
He keeps his 45 horses but buys some more cows.
Work out the number of cows he must buy.
(b) Three years ago the farmer invested $3750 at a rate of 4% per year compound interest.
(i) Calculate the total value of his investment after the 3 years.
$…………………………………………..
(ii) The farmer wants to spend his investment on buying goats.
Goats cost $126 each.
Work out the maximum number of goats he can buy and how much money is left over.
Number of goats …………………………………………….
Amount of money left over $…………………………………………..
(c) The farmer grows carrots.
In 2014 the selling price for carrots was $96 per tonne.
In 2015 this selling price increased by 18%.
Work out the increase in the selling price from 2014 to 2015.
$…………………………………………..
(d) The farmer has 20 female sheep.
Each sheep has 0, 1, 2 or 3 lambs.
The table shows this information.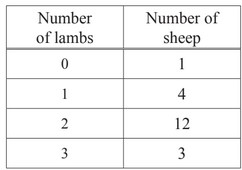
(i) Calculate the mean number of lambs per sheep.
(ii) The farmer takes 1 lamb away from each of the sheep with 3 lambs.
These lambs are given to 3 of the 4 sheep that have 1 lamb.
Complete the table after the farmer has done this.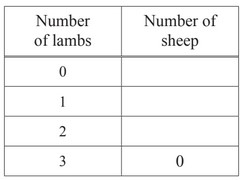
(iii) Explain why the mean number of lambs per sheep does not change.
Answer/Explanation
Ans:
(a) (i) 9:4
(ii) 7
(b) (i) 4218.24 cao
(ii) 33
60.24
(c) 17.28
(d) (i) 1.85
(ii) 1
1
18
[0]
(iii) Same total number of sheep and
same total number of lambs oe
Question
(a) The scatter diagram shows the scores for each student in class A for the written test and the speaking
test in French.
A line of best fit has been drawn.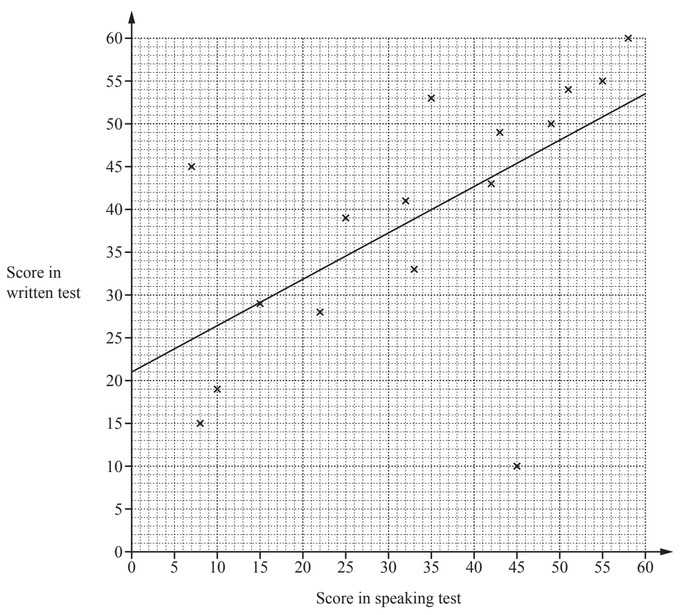
(i) Each test is marked out of 60.
In which test did the class perform better?
Give a reason for your answer.
………………………………………. because ……………………………………………………………………………..
(ii) What type of correlation is shown in the scatter diagram?
(iii) One student is much better at speaking French than writing French.
Put a ring around the cross that represents this student.
(iv) One student scored 39 in the speaking test but was absent for the written test.
Use the line of best fit to estimate a score for this student in the written test.
(b) Here are the scores in the written test for class B.
21 14 48 32 8 29 41 39 30 23 17
Find
(i) the median,
(ii) the mean.
Answer/Explanation
Ans:
(a) (i) Written test and a valid reason
(ii) Positive
(iii) (45,10) indicated
(iv) 42
(b) (i) 29
(ii) 27.5 or 27.45 to 27.46
Question
(a) The table gives some information about the numbers of visitors at a leisure centre one day.

(i) Complete the table.
(ii) Work out how many more child visitors than adult visitors there are.
………………………………………….
(iii) Write down the fraction of visitors that are adults.
Give your answer in its lowest terms.
………………………………………….
(iv) Write the ratio number of males : number of females.
Give your answer in its simplest form.
…………………. : ………………….
(v) One of these visitors is selected at random.
Find the probability that this visitor is a male child.
………………………………………….
(b) The number of people in each of 150 cars entering the leisure centre car park is recorded.
The table shows the results.
(i) Write down the mode.
………………………………………….
(ii) Calculate the mean.
………………………………………….
(c) In a survey of 50 visitors to the leisure centre, 18 used the gym.
One day, 1500 people visited the leisure centre.

Calculate an estimate for the number of people who used the gym on this day.
………………………………………….
Answer/Explanation
(a)(i) 96 144 240
129 131 260
225 275 500
(ii) 50
(iii)\frac{9}{20}
(iv) 12 : 13
(v)\frac{144}{500}
(b)(i) 1
(ii) 2.4 (c) 540
Question
Francis asks 30 families how many children they have.
The table shows the results.
| Number of children in each family | 0 | 1 | 2 | 3 | 4 | 5 |
| Number of families | 4 | 6 | 6 | 2 | 9 | 3 |
(a) (i) Write down the mode.
(ii) Find the median.
(iii) Calculate the mean.
(iv) Complete the bar chart, including the vertical scale.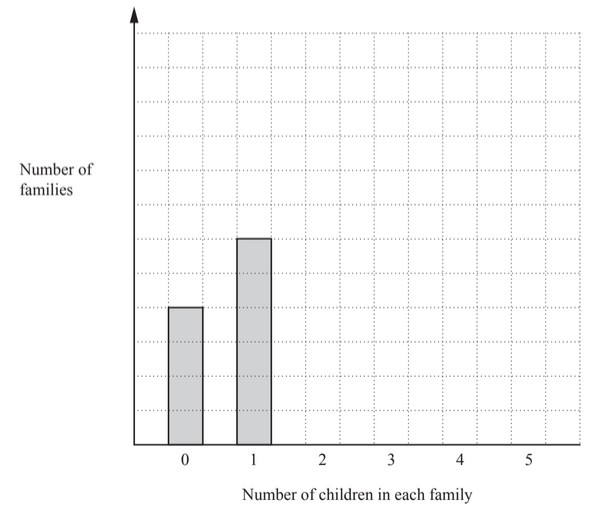
(b) Francis also recorded the age group and gender of the children aged 12 or less.
The information is shown in the table.
| Age 4 and younge | Age 5 to 8 | Age 9 to 12 | Total | |
| Male | 9 | 36 | ||
| Female | 11 | |||
| Total | 30 | 20 | 75 |
Complete the table.
(c) Francis displays the results for the totals of each age group on a pie chart.
The sector angle for the group ‘Age 4 and younger’ is 120°.
Calculate the sector angle for
(i) age 5 to 8,
(ii) age 9 to 12.
(d) Complete the pie chart.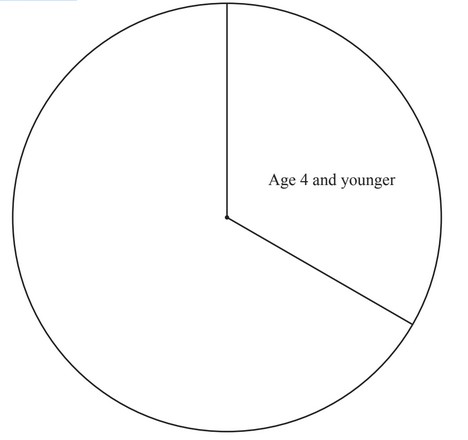
Answer/Explanation
Answer:
(a) (i) 4
(ii) 2
(iii) 2.5
(iv) 4 bars correct height, correct
width and correct gaps
Correct vertical scale shown
(b) 6 values correctly placed
14 16 [9] 39
[11] 14 11 [36]
25 [30] [20] [75]
(c) (i) 144
(ii) 144
(d) Correct line from centre to
circumference, angles 144° and
96°
Question
Mr Marr asks his mathematics class to complete a statistics project about books.
(a) Olga counts the number of letters in each of the last 50 words in the book she is reading.
She has only counted the letters in 43 words so far.
Her results for these 43 words are shown in the table below.
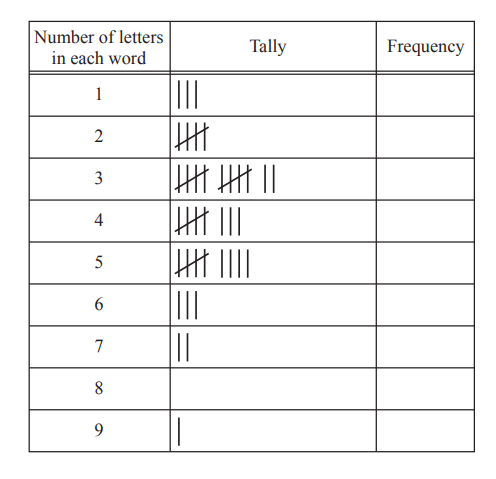
The last seven words in the book that Olga needs to add to the table are
………. and they all lived happily ever after.
(i) Complete the tally and frequency columns in the table.
(ii) Find the range.
…………………………………………
(iii) Find the median.
…………………………………………
(b) Billie asks 60 students in his school what their favourite type of book is.
He has started to draw a pictogram to show his results.
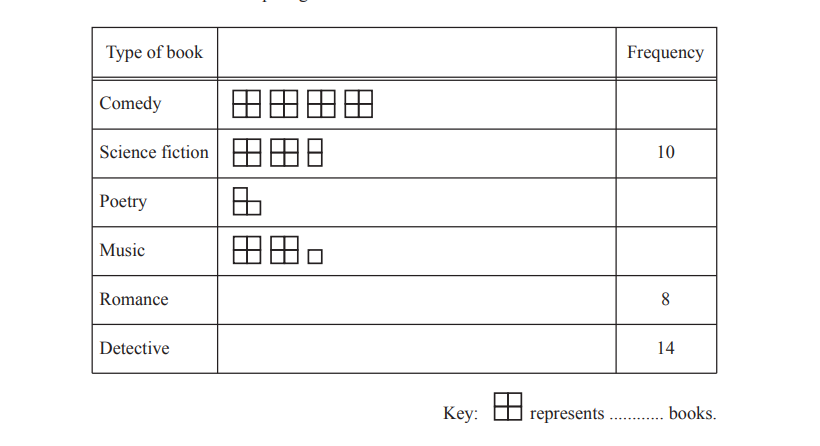
The science fiction row in the pictogram is complete.
(i) Complete the key.
(ii) Complete the pictogram.
(iii) Write down the mode.
…………………………………………
(iv) Work out how many more students choose detective books than music books.
…………………………………………
(v) Work out the fraction of students who did not choose romance books.
………………………………………….
Answer/Explanation
(a)(i) Tally for 3, 4, 5 increased by two.
Tally for 7 increased by one.
Frequencies
3, 5, 14, 10, 11, 3, 3, 0, 1
(ii) 8
(iii) 4
(b)(i) 4
(ii) 2 and 3.5 boxes drawn
16, 3 and 9 frequencies
(iii) Comedy
(iv) 5
(v)\(\frac{52}{60}\)
Question
(a) 25 students go on a water sports trip.
The students each choose their favourite water sport.
These are the results.
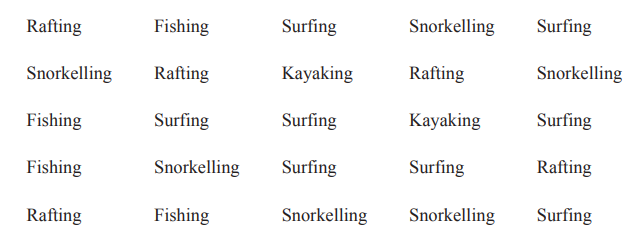
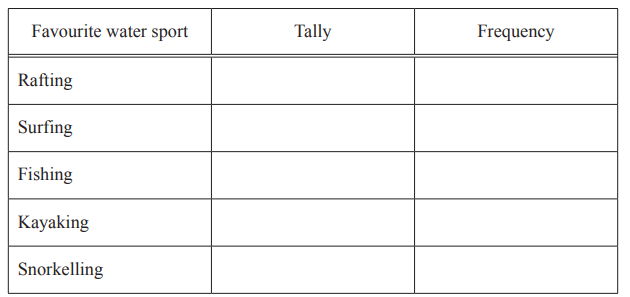
(i) Complete the frequency table for the results.
You may use the tally column to help you.
(ii) Write down the mode.
…………………………………………
(iii) Work out the percentage of students whose favourite water sport is snorkelling.
…………………………………….. %
(b) The table shows the times of the high and low tides.
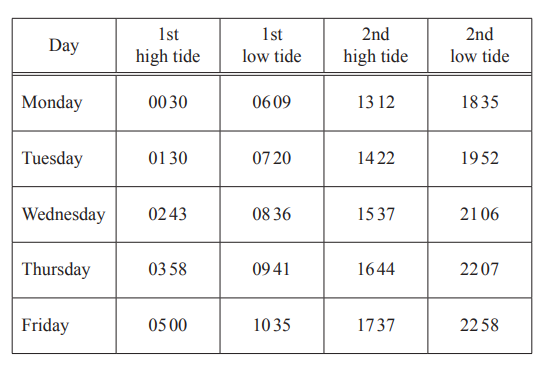
(i) Write down the time of the 2nd high tide on Wednesday using the 12-hour clock.
…………………………………………
(ii) Work out the time between the two low tides on Thursday.
………….. h ………….. min
(iii) The surfing activity starts \(1\frac{1}{2}\) hours before the high tide on Tuesday afternoon.
Write down the time that the surfing activity starts.
…………………………………………
Answer/Explanation
(a)(i)5, 8, 4, 2, 6
(ii)Surfing
(b)(i)3.37pm
(ii)12h 26min
(iii)12:52pm
Question
(a) Each of 196 candidates has a candidate number from 3001 to 3196.
The candidates sit in numerical order in columns and rows, as shown in the diagram.
There are 20 rows.
The diagram shows part of the plan for where the candidates sit
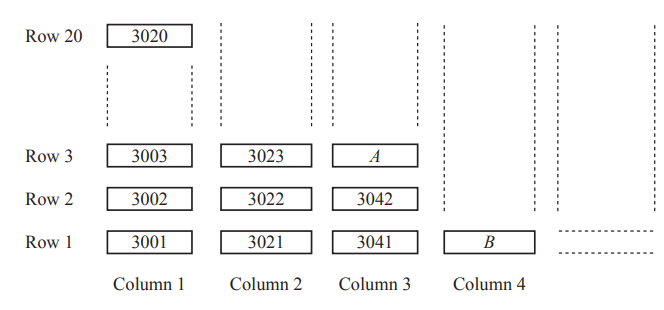
(i) The diagram shows where candidates A and B sit.
Write down their numbers.
A ………………………………………….
B . …………………………………………
(ii) Complete this statement.
Candidate 3135 sits in Column …………………….. , Row ……………………..
(iii) Candidate C sits in Column n, Row 1.
Find an expression, in terms of n, for the number of candidate C.
…………………………………………
(b)The geography examination lasts for 1 hour 40 minutes.
Hari is allowed 25% extra time for his geography examination.
Work out the total time Hari has for this examination.
Give your answer in hours and minutes.
………….. h ………….. min
(c) The number of examinations that each of the 196 candidates takes is recorded in the table.

(i) Write down the range.
…………………………………………
(ii) Find the median.
…………………………………………
(iii) Calculate the mean.
…………………………………………
(iv) A candidate is selected at random. Find the probability that the candidate takes fewer than 8 examinations.
…………………………………………
Answer/Explanation
a(i)3043
3061
(ii)Column 7 Row 15
(iii) 20n + 2981
(b)2[h] 5[min]
(c)(i)3
(ii)7
(iii)6.84 or 6.836 to 6.837 or \(6\frac{41}{49}\)
(iv)\(\frac{132}{196}\)
Question
The line L is shown on the grid.
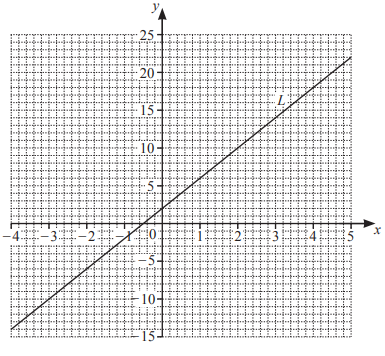
(a) Find the equation of the line L in the form y = mx + c.
y = [3]
(b) The equation of a different line is y = 3x – 4.
(i) Write down the gradient of this line.[1]
(ii) Write down the co-ordinates of the point where this line crosses the y˗axis.
( ___ , ___ ) [1]
(c) On the grid, draw the graph of y = – 2x+1 for \(-4\leqslant x\leqslant 5\).[3]
Answer/Explanation
Ans:
6(a) 4x + 2
6(b)(i) 3
6(b)(ii) (0, –4)
6(c) Correct ruled line
from x = –4 to x = 5
Question
(a) On Monday, Main Street station sells 40 tickets.
There are four types of ticket; infant, child, adult and senior.
The bar chart shows the number of infant, child and adult tickets sold.
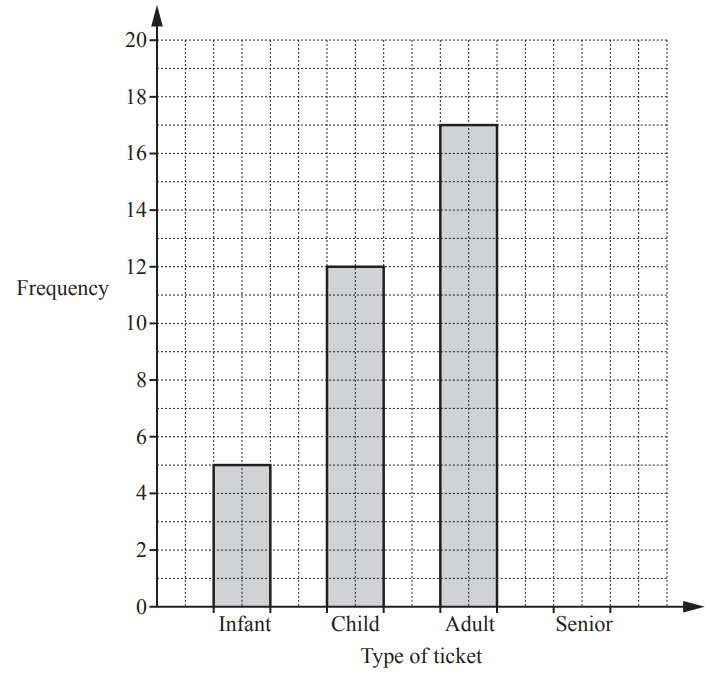
(i) Complete the bar chart. [3]
(ii) Find how many more adult tickets were sold than child tickets.[1]
(iii) Write down the modal type of ticket.[1]
(iv) One of these 40 people is chosen at random.
Find the probability that this person is a child.[1]
(b) At Donville station the number of tickets sold each day is recorded for seven days.
104 18 72 31 27 45 60
Find
(i) the range,[1]
(ii) the median,[2]
(iii) the mean.[2]
Answer/Explanation
Ans:
3(a)(i) Correct bar
3(a)(ii) 5
3(a)(iii) Adult
3(a)(iv) \frac{12}{40} oe
3(b)(i) 86
3(b)(ii) 45
3(b)(iii) 51
Question
(a) 20 students from College A each run 5km. The times, correct to the nearest minute, are recorded.
32 51 25 40 47 21 37 32 48 36
46 39 30 29 44 39 53 35 40 31
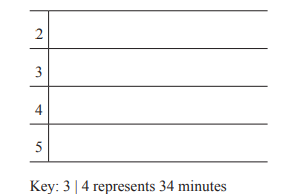
(i) Complete the stem-and-leaf diagram.
(ii) Find the range of the times.
…………………………………… min
(iii) Find the median of the times.
…………………………………… min
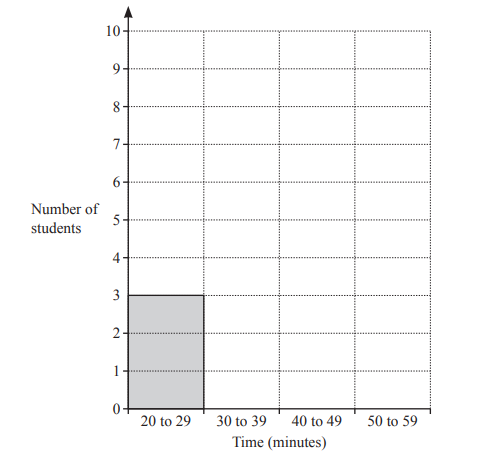
(iv) Complete the bar chart for the times of the students.
b) 20 students from College B each run 5km.
Their times, correct to the nearest minute, are recorded and the results are shown in the table.
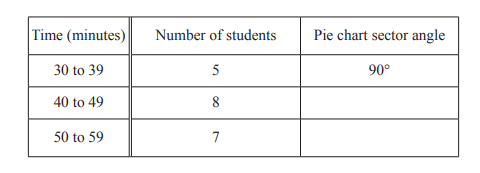
(i) Complete the table.
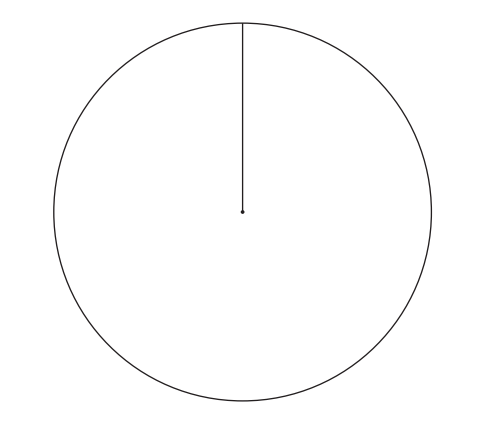
(ii) Complete the pie chart.
(c) Write down two comments comparing the times of students from College A with the times of
students from College B. ………………………………………………………………………………………………………………………………..
……………………………………………………………………………………………………………………………….. ………………………………………………………………………………………………………………………………..
………………………………………………………………………………………………………………………………..
Answer/Explanation
(a)(i) [2] 1 5 9
[3] 0 1 2 2 5 6 7 9 9
[4] 0 0 4 6 7 8
[5] 1 3
(ii) 32
(iii) 38
(iv) Correct bar chart
(b)(i) 144
126
(ii) Correct pie chart
(c) 2 correct expressions
Question
(a) Jian has a fair spinner in the shape of a regular hexagon.
The spinner is numbered 2, 2, 3, 4, 4, 5.
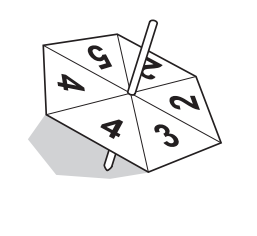
Jian spins the spinner.
Find the probability that the spinner lands on
(i) an even number,
………………………………………….
(ii) a number less than 6,
………………………………………….
(iii) the number 1
(b) Mei has two fair square spinners, A and B.
Spinner A is numbered 1, 2, 2, 4 and spinner B is numbered 3, 3, 4, 5.
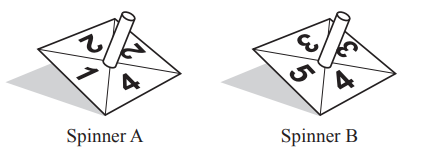
She spins both spinners and adds the two numbers.
(i) Complete the table to show all the possible outcomes.
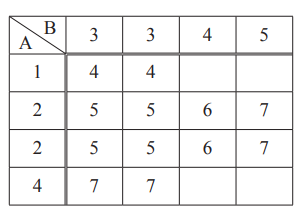
(ii) Use the table to write down the probability that the total is
(a) 5,
………………………………………….
(b) more than 5.
………………………………………….
(c) Ning has a spinner numbered 1 to 6.
She spins it 50 times and her results are shown in the table.
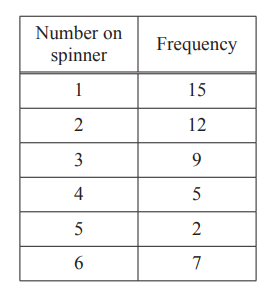
(i) Write down the mode.
………………………………………….
(ii) Find the median.
………………………………………….
(iii) Work out the mean.
………………………………………….
Answer/Explanation
(a)(i)\(\frac{2}{3}\)
(ii) 1
(iii) 0
(b)(i) 5 6
8 9
in the correct places
(ii)(a)\( \frac{5}{16}\)
(b) \(\frac{9}{16}\)
(c)(i) 1
(ii) 2
(iii) 2.76
Question
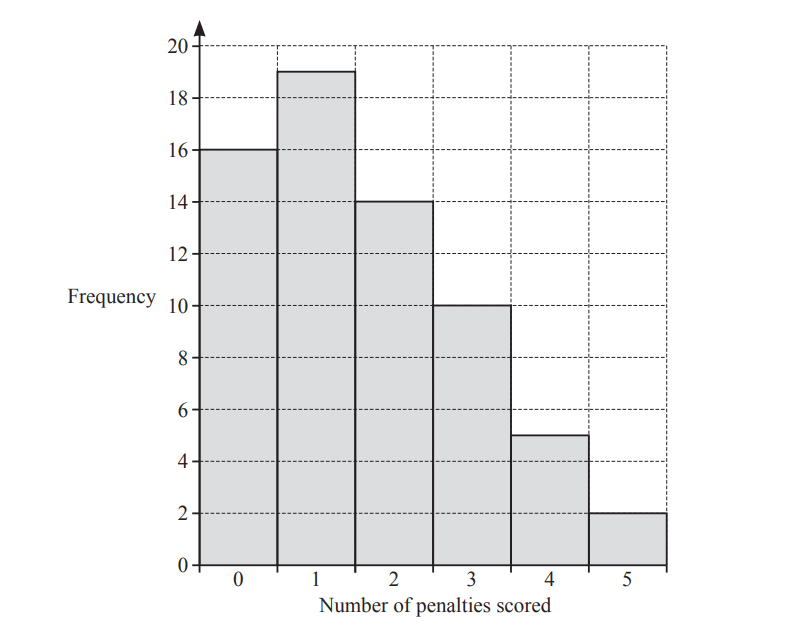
(a) 66 football players each take five penalties.
The number of penalties that each player scores is recorded.
The results are shown in the bar chart.
(i) Write down the mode.
………………………………………….
(ii) Write down the range.
………………………………………….
(iii) Calculate the mean.
………………………………………….
(b) The attendance at a football match is 11 678.
(i) Write 11678 in words.
……………………………………………………………………………………………………………………………
(ii) Write 11678 correct to the nearest 100.
………………………………………….
(c) In a football stadium there are 15000 seats.
10650 of these seats are occupied.
Find the percentage of the 15000 seats that are occupied.
……………………………………… %
(d) A ticket to a football match costs \($20.\)
Calculate the cost of the ticket in rupees when the exchange rate is 1 rupee = \($0.016\)
……………………………….. rupees.
Answer/Explanation
(a)(i) 1
(ii) 5
(iii) 1.62 or 1.621…
(b)(i) Eleven thousand six hundred (and)
seventy-eight
(b)(ii) 11700
(c) 71
(d) 1250
Question
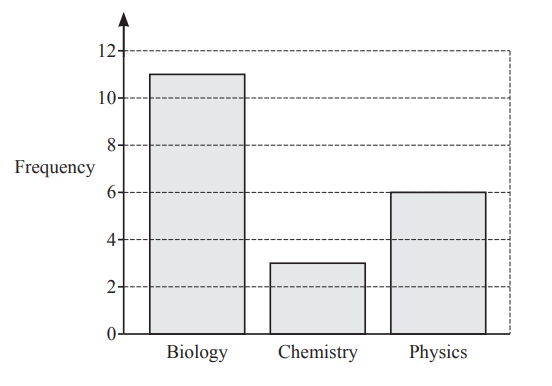
20 students choose their favourite science subject.
The results are shown in the bar chart.
(a) Work out how many more students choose biology than physics.
………………………………………….
(b) Write down the fraction of students whose favourite science subject is chemistry.
………………………………………….
(c) One of the 20 students is picked at random.
Write down the probability that this student did not choose biology.
………………………………………….
(d) Only one of the averages, median, mode and mean can be found for these results.
(i) Write down the average that can be found.
………………………………………….
(ii) Find this average for these results.
………………………………………….
(iii) Explain why the range cannot be found.
……………………………………………………………………………………………………………………………
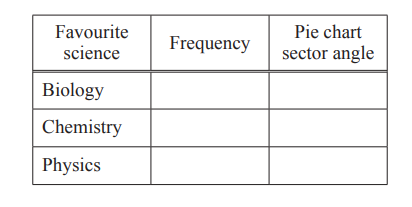
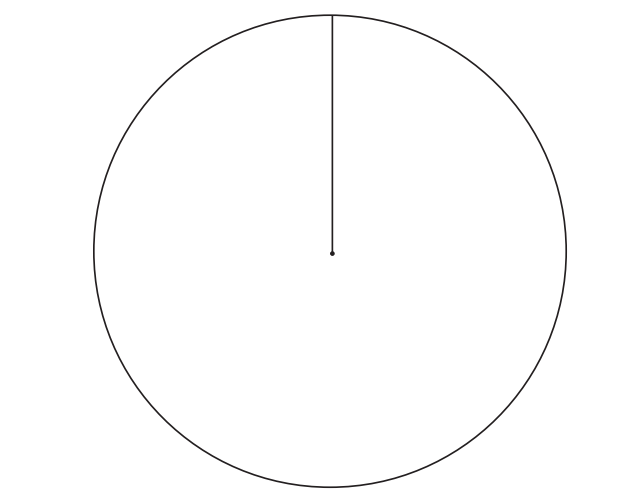
(e) The results are to be shown in a pie chart.
(i) Complete the table,
(ii) Complete the pie chart.
Answer/Explanation
(a) 5
(b)\(\frac{3}{20}\)
(c)\(\frac{9}{20}\)
(d)(i) Mode
(ii) Biology
(iii) Correct reason
(e)(i) 11 198
3 54
6 108
(ii) Correct pie chart drawn
Question
(a)
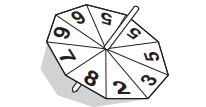
The diagram shows a fair 9-sided spinner.
The numbers on the spinner are 2, 3, 5, 5, 5, 6, 6, 7 and 8.
(i) The spinner is spun once.
Write down the probability that the spinner lands on
(a) the number 8,
Answer/Explanation
Ans: \(\frac{1}{9}oe\)
(b) a number less than 7.
Answer/Explanation
Ans: \(\frac{7}{9}oe\)
(ii) The spinner is spun 135 times.
Work out the expected number of times the spinner lands on the number 6.
Answer/Explanation
Ans: 30
(b) Hitesh throws a dice 80 times.
The results are shown in the table.
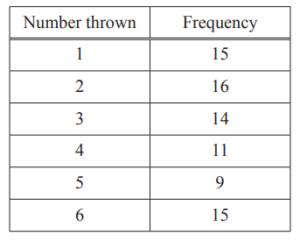
(i) Write down the mode.
Answer/Explanation
Ans: 2
(ii) Work out the range.
Answer/Explanation
Ans: 5
(iii) Work out the median.
Answer/Explanation
Ans: 3
(iv) Calculate the mean.
Answer/Explanation
Ans: 3.35
Question
20 students choose their favourite science subject.
The results are shown in the bar chart.

(a) Work out how many more students choose biology than physics.
………………………………………….
(b) Write down the fraction of students whose favourite science subject is chemistry.
………………………………………….
(c) One of the 20 students is picked at random.
Write down the probability that this student did not choose biology.
………………………………………….
(d) Only one of the averages, median, mode and mean can be found for these results.
(i) Write down the average that can be found.
………………………………………….
(ii) Find this average for these results.
………………………………………….
(iii) Explain why the range cannot be found.
……………………………………………………………………………………………………………………………
(e) The results are to be shown in a pie chart.
(i) Complete the table,

(ii) Complete the pie chart.

Answer/Explanation
(a) 5
(b)\(\frac{3}{20}\)
(c)\(\frac{9}{20}\)
(d)(i) Mode
(ii) Biology
(iii) Correct reason
(e)(i) 11 198
3 54
6 108
(ii) Correct pie chart drawn
Question
(a) Jon spins this 6-sided spinner.
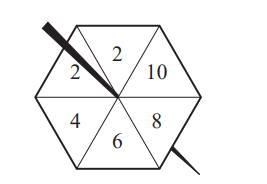
The probability that the spinner lands on any of the six sides is equally likely.
Write down the probability that the spinner lands on
(i) the number 6,
Answer/Explanation
Ans: \(\frac{1}{6}oe\)
(ii) a prime number,
Answer/Explanation
Ans: \(\frac{2}{6}oe\)
(iii) a number less than 11.
Answer/Explanation
Ans: 1
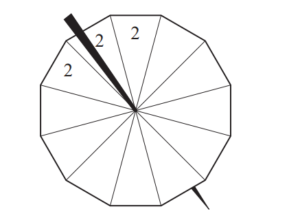
(b) Felix has a 12-sided spinner with the numbers 2, 4, 5, 7 and 9 written on it.
It is equally likely to land on any side.
The table shows the probability of the spinner landing on each number.

The diagram of the spinner has been completed for the number 2.
Complete the diagram for the numbers 4, 5, 7 and 9.
Answer/Explanation
Ans: (2,2,2), 4,4,4,4,5,5,7,7,9 seen on spinner
(c) Felix says that his spinner is more likely to land on a 2 than Jon’s spinner.
Explain why he is wrong.
Answer/Explanation
Ans: Felix’s probability is \(\frac{3}{12}\) which is
less than Jon’s probability \(\left (of\frac{2}{6} \right )\) which is \(\frac{4}{12}oe\)
(d) Felix spins his 12-sided spinner 60 times and records the results.
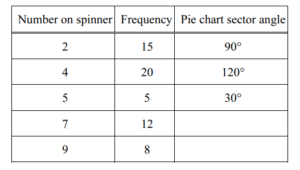
(i) Complete the table by working out the sector angles for the numbers 7 and 9 .
Answer/Explanation
Ans: (90°, 120°, 30°), 72°, 48°
(ii) Complete the pie chart.
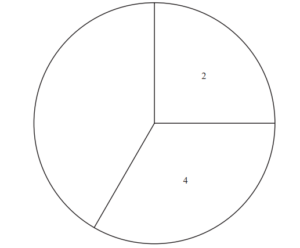
Answer/Explanation
Ans: 30° angle correct 72°, 48°
(iii) Write down the mode.
Answer/Explanation
Ans: 4
(iv) Calculate the mean.
Answer/Explanation
Ans: 4.85
Question
(a) Amir asked 15 friends how many hours they spent playing sport last weekend. His results are shown in the table below.

(i) Write down the mode.
Answer/Explanation
Ans: 0
(ii) Find the median.
Answer/Explanation
Ans: 1
(iii) Calculate the mean.
Answer/Explanation
Ans: 1.6
(iv) On the grid, draw a bar chart to show the information given in the table.
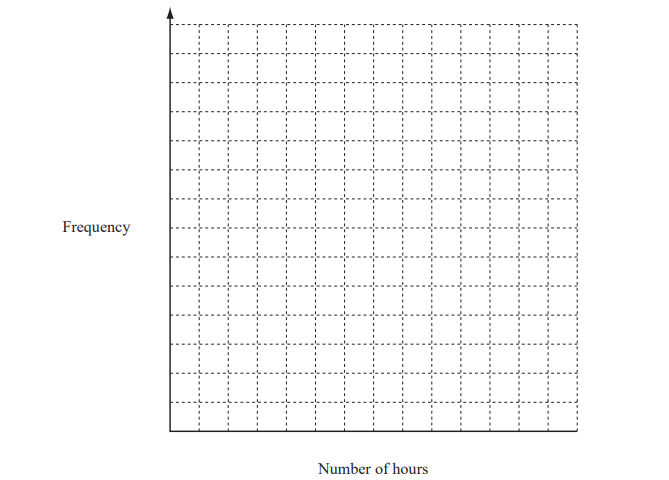
Answer/Explanation
Ans: Bar chart with
– horizontal axis correctly labelled
– and vertical axis correctly scaled
– and bars of correct height and equal width,
– and with equal gaps or no gaps
(b) Amir also asked these 15 friends which was their favourite sport. His results are shown in the table below.
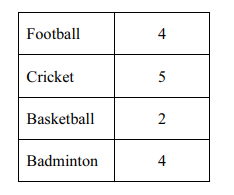
Amir picks one of these friends at random. Write down the probability that his friend’s favourite sport is
(i) cricket,
Answer/Explanation
Ans: \(\frac{5}{15}or\frac{1}{3}\)
(ii) not football,
Answer/Explanation
Ans: \(\frac{11}{15}\)
(iii) basketball or badminton.
Answer/Explanation
Ans: \(\frac{6}{15}or\frac{2}{5}\)
Question
36 29 41 45 15 10 13
Use the numbers in the list above to answer all the following questions.
(a) Write down
(i) two even numbers,
(ii) two prime numbers,
(iii) a square number,
(iv) two factors of 90 .
(b) (i) Calculate the mean of the seven numbers
(ii) Find the median.
(iii) Find the range.
(c) A number from the list is chosen at random.
Find the probability that the number is
(i) even,
(ii) a multiple of 5
Answer/Explanation
(a) (i) 36,10
(ii) 29,41
(iii) 36=\(6^2\)
(iv) 45,10
(b)(i) Mean=\(\frac{Sum of total numbers}{Total number}\)
Mean =\(\frac{36 + 29 + 41 + 45 + 15 + 10 + 13}{7} = \frac{189}{7}\)
=27
(ii) To find the median, we first need to arrange the numbers in order:
10, 13, 15, 29, 36, 41, 45
Since, there are odd number of numbers, so the median is the middle number
Median = 29
(iii)Range= Largest number- Smallest number
=45 – 10
= 35
(c) The total number of elements in the list is 7.
(i) The even numbers in the list are 36, 10.
P(even) = \(\frac{Number of even numbers}{Total number of elements}
= \(\frac{2}{7}\)
Therefore, the probability of choosing an even number at random from the list is approximately 0.286
(ii) The multiples of 5 in the list are: 45, 15, 10.
P(multiple of 5) = \(\frac{Number of multiples of 5}{Total number of elements}\)
\(\frac{3}{7}\)
Question
Twelve students each answer 30 questions in a quiz.
The time taken and the number of correct answers for each student is given in the table.

(a) Complete the scatter diagram below to show this information. The first six points have been plotted for you.
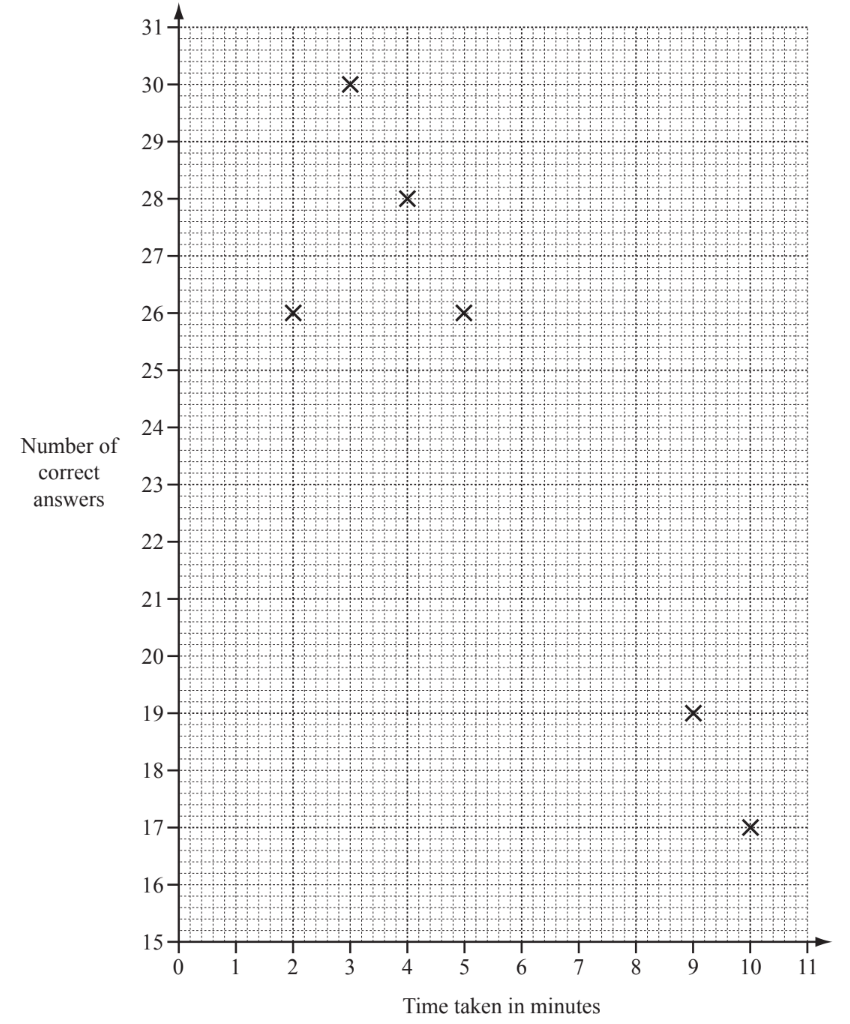
(b) What type of correlation does the scatter diagram show?
(c) (i) Find the range of the time taken.
(ii) Calculate the mean time taken.
(d) (i) Find the mode for the number of correct answers.
(ii) Find the median for the number of correct answers.
(e) One of the 12 students is selected at random. Write down the probability that the student
(i) took more than 8 minutes to answer the quiz,
(ii) took less than 5 minutes and had more than 24 correct answers.
▶️Answer/Explanation
(a) 6 points correctly plotted
(b) negative cao
(c) (i) $8 \mathrm{cao}$
(ii) $\operatorname{art} 5.92$
(d) (i) $26 \mathrm{cao}$
(ii) 23.5 cao
(e) (i) $\frac{2}{12}$ oe
(ii) $\frac{3}{12}$ oe
Question
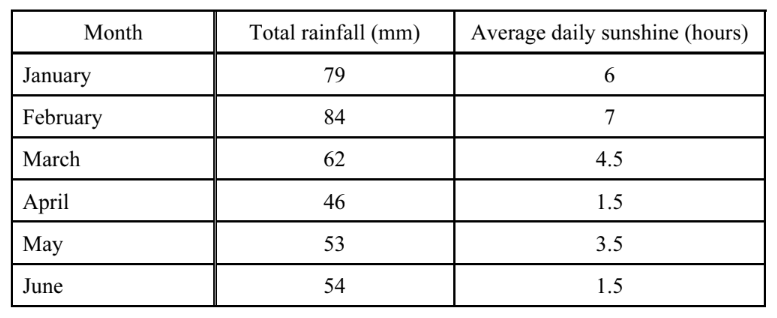
The table shows some data about rainfall and sunshine.
(a) For the rainfall, calculate
(i) the mean,
(ii) the range.
(b) For the sunshine, find
(i) the mode,
(ii) the median.
(c) Dinesh draws a pie chart to display the rainfall data. Calculate the sector angle for February.
(d) Amalia draws a pictogram to display the sunshine data for January and February.

(i) Complete the key for the pictogram.
(ii) Complete the pictogram for March.
(e) Priya draws a scatter diagram to find the correlation between rainfall and sunshine for January to June.
(i) Complete the scatter diagram below. January and February are plotted for you.
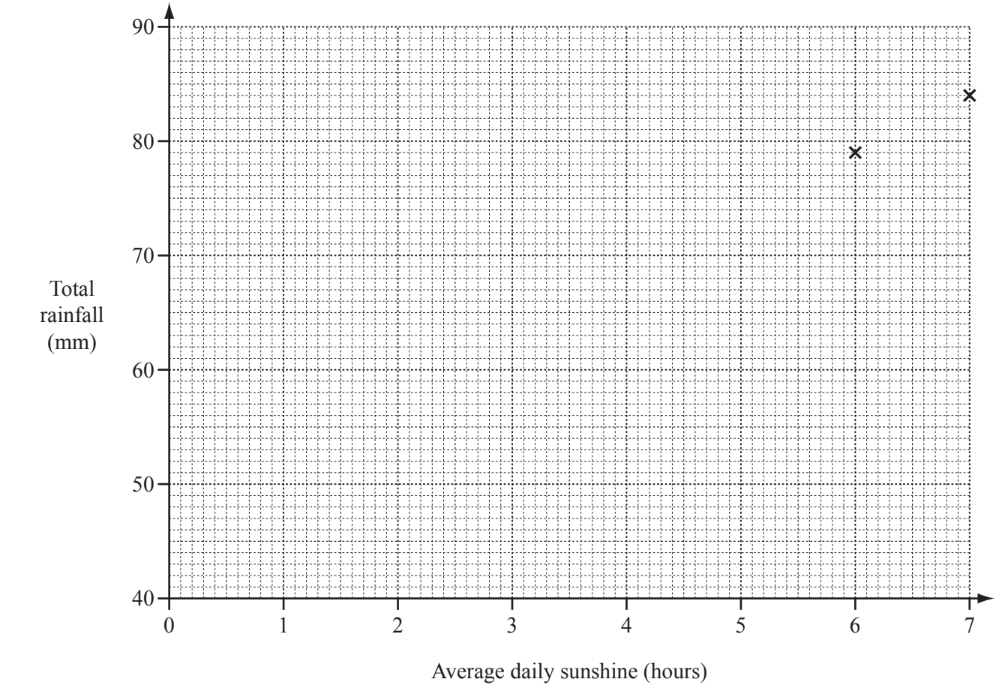
(ii) What type of correlation does the scatter diagram show?
▶️Answer/Explanation
(a) (i) 63
(ii) 38 cao
(b) (i) $1.5 \mathrm{cao}$
(ii) 4
(c) $80^{\circ}$
(d) (i) 1 hour
(ii) 4 and a half more suns drawn
(e) (i) 4 correct plots
(ii) Positive
Question
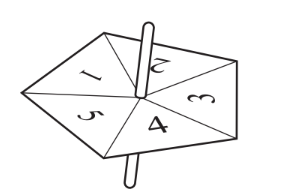
Jonah uses a fair five-sided spinner in a game.
(a) What is the probability that the spinner lands on
(i) 3 ,
(ii) an even number,
(b) Jonah spins the spinner 25 times and records the results in a frequency table.
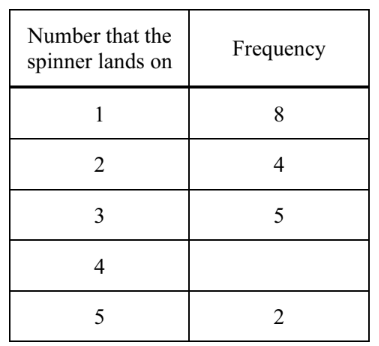
(i) Fill in the missing number.
(ii) Write down the mode.
(iii) Calculate the mean.
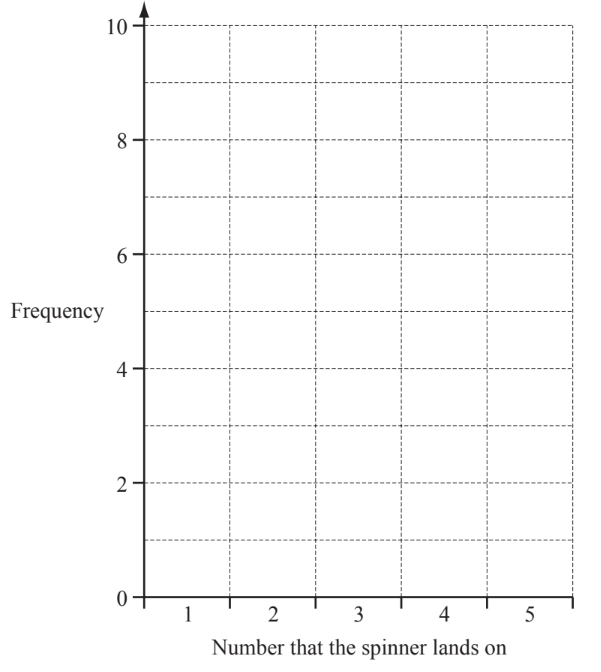
(iv) On the grid, draw a bar chart to show these results.
▶️Answer/Explanation
(a) (i) $1 / 5$
(ii) $2 / 5$
(iii) 0
(b) (i) 6
(ii) 1
(iii) $2.6(0) \mathrm{www}$
(iv) heights $8,4,5,2$ 6 or $\mathrm{ft}$ height for their (b) (i)
