Question
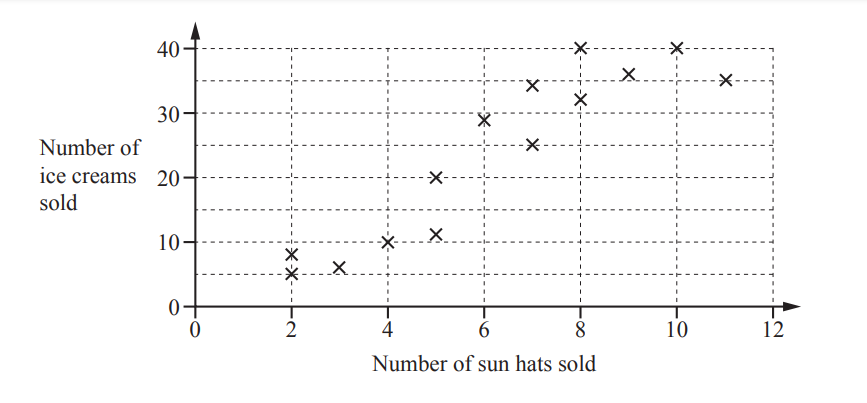
The scatter diagram shows the number of sun hats and ice creams sold by a shop each day for two weeks.

(a) Write down the type of correlation shown by the diagram.
Answer/Explanation
Ans: positive
(b) Describe the relationship between the number of sun hats sold and the number of ice creams sold.
Answer/Explanation
Ans: More ice creams sold,
more sun hats sold oe
Question
Write down the type of correlation there is between
(a) the number of litres of fuel used by a car and the distance it travels,
(b) the test score of a student and their shoe size.
Answer/Explanation
Ans:
(a) Positive
(b) Zero oe
Question
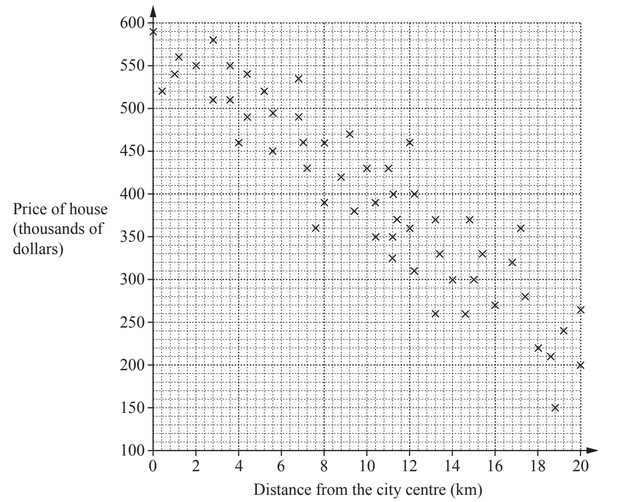
The scatter diagram shows the prices of houses for sale and their distances from the city centre.
(a) What type of correlation is shown in this scatter diagram?
(b) Brad wants to live as close to the city centre as possible.
He has a maximum of $500000 to spend on one of these houses.
How close to the city centre can he live?
…………………. km
(c) (i) Draw a line of best fit on the scatter diagram.
(ii) Estimate the price of a house that is 14km from the city centre.
$ ……………………………………………
Answer/Explanation
Ans:
(a) Negative
(b) 4
(c) (i) Ruled line of best fir
(ii) 250 000 to 380 000
Question
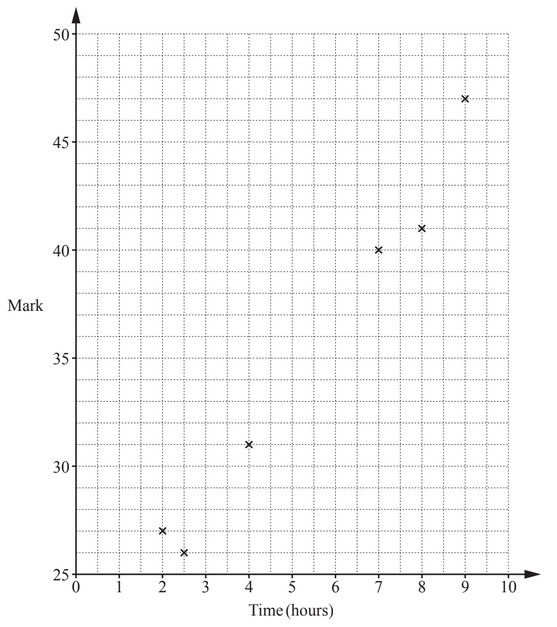
Six students revise for a test.
The scatter diagram shows the time, in hours, each student spent revising and their mark in the test.
(a) The data for two more students is shown in the table.
Plot these two points on the scatter diagram.
(b) What type of correlation is shown on the scatter diagram?
(c) Draw a line of best fit on the scatter diagram.
(d) Another student spent 5.5 hours revising.
Estimate a mark for this student.
Answer/Explanation
Ans:
(a) Points plotted at
(4.5, 33) and (6.5, 35)
(b) Positive
(c) Correct ruled line
(d) 33.5 to 37.5
