
CIE iGCSE Maths E9.2 Interpreting statistical data Exam Style Practice Questions Paper 4 - New Syllabus
(a) Jianyu records the time, in seconds, that some cars take to travel 195m. The box and whisker plot shows this information.
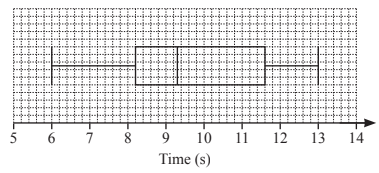
(i) Find the median time.
(ii) Find the interquartile range.
(iii) Find the difference between the average speed of the fastest car and the average speed of the slowest car. Give your answer in kilometres per hour.
(b) Matilda records the distances that 80 different cars can travel with a full tank of fuel. The table shows this information.

(i) Write down the class interval that contains the median.
(ii) Calculate an estimate of the mean.
(iii) A histogram is drawn to show the information in the table. The height of the bar for the interval \(250 \leqslant d \leqslant 300\) is 2.8 cm. Calculate the height of the bar for each of the following intervals.
(iv) Two of the 80 cars are chosen at random. Find the probability that, with a full tank of fuel, one of the cars can travel more than 450km and the other car can travel not more than 300 km.
▶️ Answer/Explanation
(a)(i) Ans: 9.3
The median is the middle line in the box plot, which is at 9.3 seconds.
(a)(ii) Ans: 3.4
Interquartile range (IQR) = Upper Quartile (11.6) – Lower Quartile (8.2) = 3.4 seconds.
(a)(iii) Ans: 63
Fastest car speed = 195/6 = 32.5 m/s. Slowest car speed = 195/13 = 15 m/s. Difference = 17.5 m/s = 63 km/h.
(b)(i) Ans: 420 < d < 450
Median is at the 40th value, which falls in the 420-450 km class interval.
(b)(ii) Ans: 411.25
Mean = (Sum of midpoints × frequencies) / total frequency = 32900/80 = 411.25 km.
(b)(iii) Ans: 2.6, 19, 14
Using the scaling factor 20, heights are calculated as (frequency/class width) × 20.
(b)(iv) Ans: 7/158
Probability = (20/80 × 7/79) + (7/80 × 20/79) = 280/6320 = 7/158.