Question
Lauris records the mass and grade of 300 eggs. The table shows the results.

(a) Find the probability that an egg chosen at random is graded very large.
Answer/Explanation
Ans: \(\frac{7}{25}or\frac{84}{300}oe\)
(b) The cumulative frequency diagram shows the results from the table.
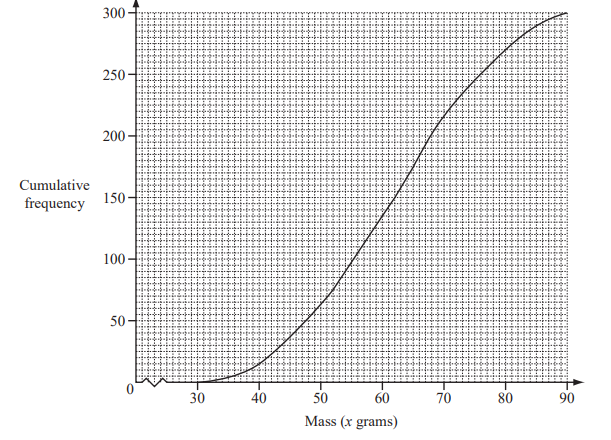
Use the cumulative frequency diagram to find
(i) the median,
Answer/Explanation
Ans: 62
(ii) the lower quartile,
Answer/Explanation
Ans: 52
(iii) the inter-quartile range,
Answer/Explanation
Ans: 19 to 20
(iv) the number of eggs with a mass greater than 65 grams.
Answer/Explanation
Ans: 125
Question
The cumulative frequency diagram shows information about the time, m minutes, taken by 120 students to
complete some homework.
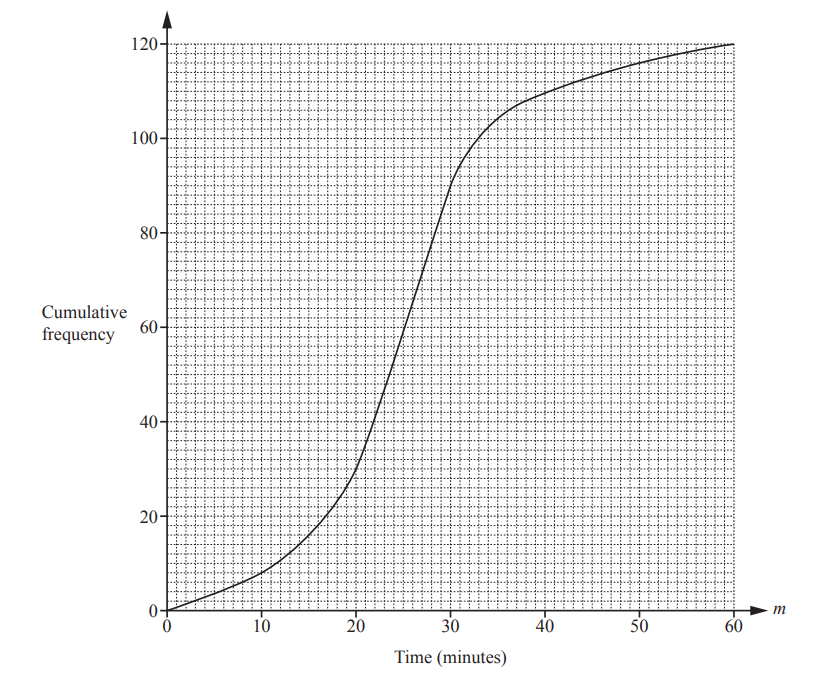
Use the cumulative frequency diagram to find an estimate of
(a) the interquartile range,
…………………………………min
(b) the number of students who took more than 50 minutes to complete the homework.
……………………………………….
Answer/Explanation
(a) 10
(b) 4
Question
Simon records the heights, h cm, of 200 sunflowers in his garden.
The cumulative frequency diagram shows this information.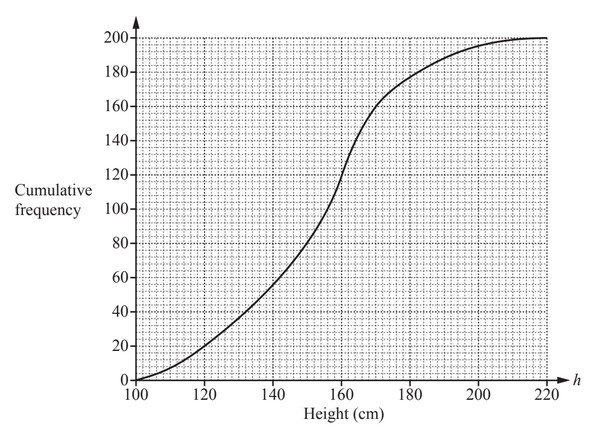
(a) Find the number of these sunflowers that have a height of more than 160cm.
(b) Sue records the heights, hcm, of 200 sunflowers in her garden.
The cumulative frequency table shows this information.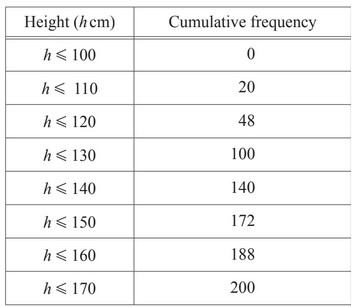
On the grid above, draw another cumulative frequency diagram to show this information.
(c) Work out the difference between the median heights of Simon’s sunflowers and Sue’s sunflowers.
………………………….. cm
Answer/Explanation
Ans:
(a) 80 to 84
(b) Correct curve or ruled lines
(c) 26
Question
Gemma records the times, in seconds, taken for a group of children and a group of adults to complete a
puzzle.
The box-and-whisker plot shows information about the times taken for the children to complete the
puzzle.
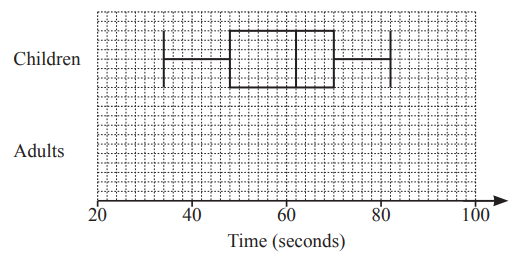
(a) Find the interquartile range of the times taken for the children to complete the puzzle.
……………………………… seconds
(b) The table shows some information about the times, in seconds, taken for the adults to complete the
puzzle.

On the grid above, draw the box-and-whisker plot for the adults
Answer/Explanation
(a) 22
(b)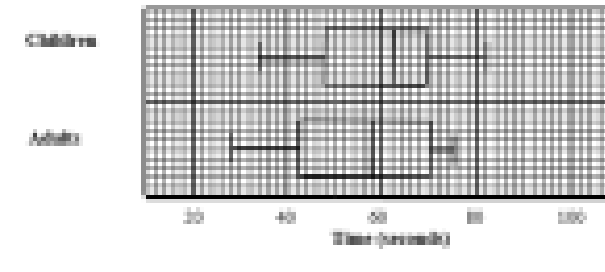
Question
The number of hours that a group of 80 students spent using a computer in a week was recorded. The results are shown by the cumulative frequency curve.
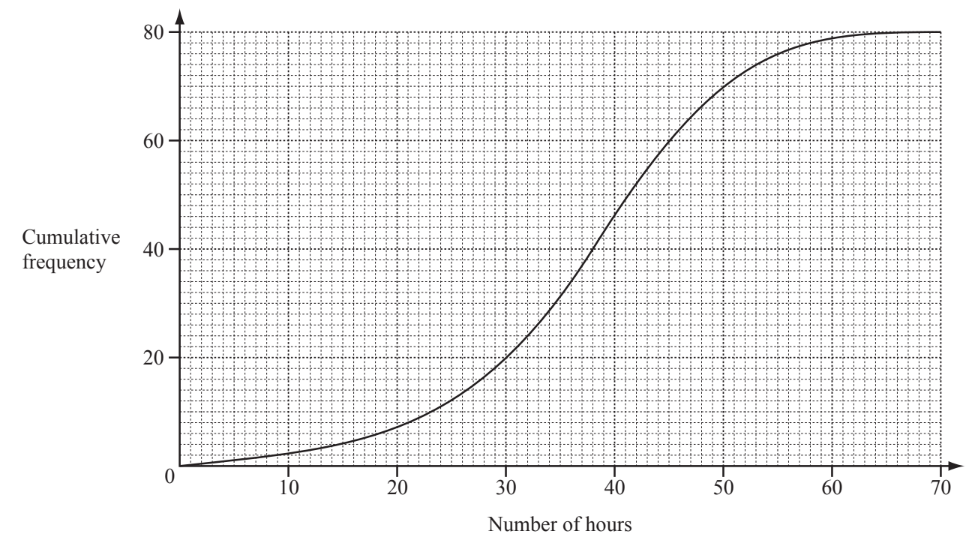
Use the cumulative frequency curve to find
(a) the median,
(b) the upper quartile,
(c) the interquartile range,
(d) the number of students who spent more than 50 hours using a computer in a week.
▶️Answer/Explanation
(a) 38
(b) 45 to 46
(c) 15 to 16
(d) 10 or 11
