Question
A family goes on holiday in a car. To stop the journey being boring for the children, every half
an hour they note down the distance they have travelled since they left home. They then plot
the graph shown in Fig. 5.1.
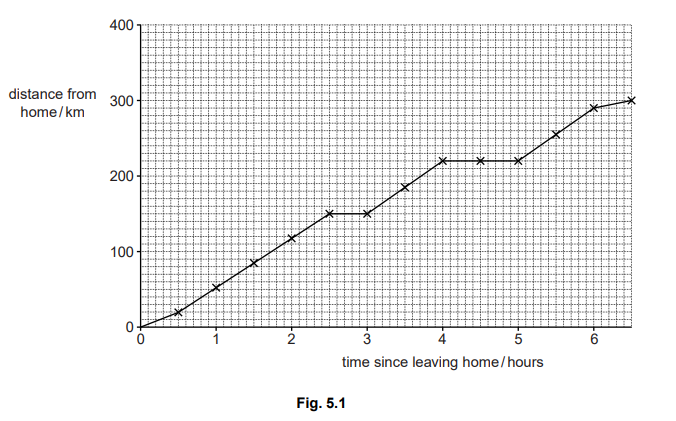
The first half hour and the last half hour of their journey are on small roads. The rest of the
journey is on major roads.
Answer the following questions using information from Fig. 5.1.
(a) For how many hours were they travelling on major roads?
time =…………………………………….. hours [1]
(b)How far did they travel
1. in total,
total distance =……………………………….. km
2. on small roads,
distance on small roads =………………………………. km
3. on major roads?
distance on major roads = ……………………………….km [3]
(c) They had two refreshment stops whilst on the journey.
On Fig. 5.1, clearly mark where they had these stops. [1]
(d) Apart from the times when they stopped, during which section of the journey was their
speed slowest? Explain your answer.
section ………………………………………………………………………………………………………………
explanation ………………………………………………………………………………………………………..
…………………………………………………………………………………………………………………………[2]
(e) Calculate the average speed for the whole journey. Your answer must include the unit.
average speed =………………………………………….. [4] [Total: 11]
Answer/Explanation
Ans: (a) 4 (hours) OR 5 ½ / 5.5 (hours) / 5 hours 30 mins
(b) (i) 300 (km)
(ii) 30 (km)
(iii) 270 (km) e.c.f. (i) & (ii)
(c) 2 horizontal sections clearly indicated
(d) last section, however expressed e.g. after 6 hours smallest slope OR smallest distance in ½ hour
(e) distance ÷ time 300 ÷ 6.5 answer in range 46–46.2 A1 correct unit e.g. km / h
Question
A car is travelling along a level road at a steady speed. Fig. 1.1 shows the speedometer in the car. A speedometer registers how fast the car is going.
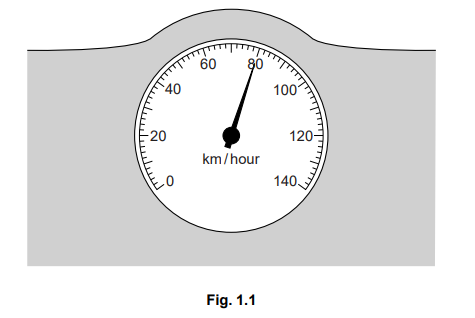
(a)How far, in km, does the car travel in ½ hour at the speed shown in Fig. 1.1?
distance = …………………………………… km [3]
3
(i) On the axes shown in Fig. 1.2, draw a line representing the motion of the car for the
½ hour mentioned in (a). Do not go beyond ½ hour. [3]
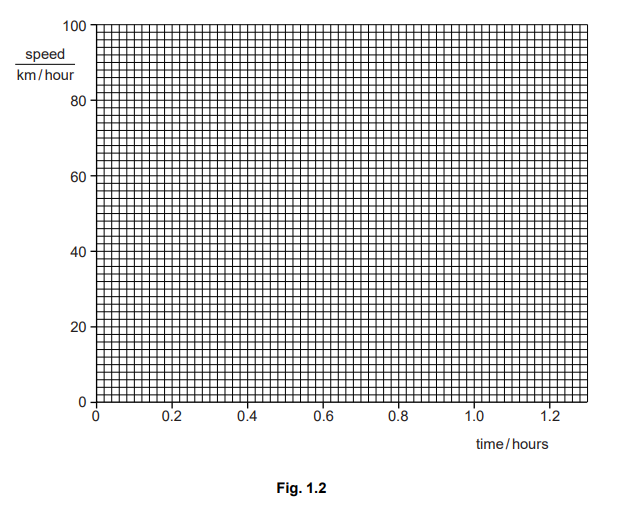
(ii) At the end of the ½ hour, the car reaches a region where the road begins to rise up
into some mountains. The car climbs the mountains for a further ½ hour.
During the climb, its speed steadily decreases to 30 km / hour. The driver then stops
the car so that he can admire the view.
On Fig. 1.2, draw a line representing the climb and the stopping of the car. [4][Total: 10]
Answer/Explanation
Ans: (a) speed = distance ÷ time in any form OR (distance =) speed × time 80 × ½ OR 80 × 0.5 40(km)
(b) (i) First section of line:
horizontal line starting at zero time, any speed at 80km/hour from 0 to 0.5 hour, no further
(ii) Second section of line: straight line sloping down line starting at end of previous section and ending at 1 hour (condone not straight) line ending at 30km/hour Third section of line: vertical/near vertical line down to 0 at 1 hour ignore further sections of graph