Question Easy
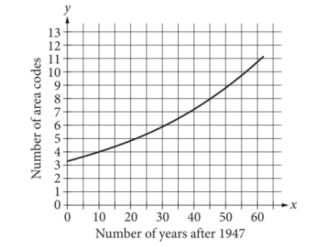
The graph shown models the number of area codes assigned to phone numbers in Illinois from 1947 through 2009, where \(x\) represents the number of years after 1947. Which equation represents this relationship?
A) \(y=1.02(3.26)^{-x}\)
B) \(y=3.26(1.02)^{-x}\)
C) \(y=1.02(3.26)^x\)
D) \(y=3.26(1.02)^x\)
▶️Answer/Explanation
Ans:D
Given that the number of area codes is growing over time, the graph suggests an exponential growth pattern. The general form of an exponential growth equation is:
\[
y = a(b)^x
\]
Looking at the given options, the correct form must match this pattern. The options are:
A) \( y = 1.02(3.26)^{-x} \)
B) \( y = 3.26(1.02)^{-x} \)
C) \( y = 1.02(3.26)^x \)
D) \( y = 3.26(1.02)^x \)
Since the graph shows an increasing trend, we are dealing with exponential growth, so the exponent should not have a negative sign, ruling out options A and B.
Next, we look at options C and D:
Option C: \( y = 1.02(3.26)^x \)
Option D: \( y = 3.26(1.02)^x \)
To decide between these, we need to check the initial value and the base of the exponent. The graph starts at a point around 3 area codes when \( x = 0 \).
In option C, the initial value \( a = 1.02 \), which does not match our initial observation.
In option D, the initial value \( a = 3.26 \), which is closer to the starting value seen in the graph.
Therefore, the correct equation representing this relationship is:
D) \( y = 3.26(1.02)^x \)
Question Easy
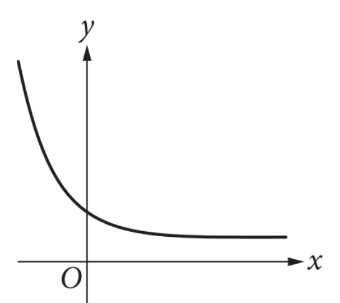
The graph of the function \(t\) is shown, where \(y=t(x)\). Which of the following types of functions is graphed?
A. Increasing linear
B. Decreasing linear
C. Increasing exponential
D. Decreasing exponential
▶️Answer/Explanation
Ans:D
A. Increasing linear:
- Straight line sloping upwards from left to right
- Constant rate of change (slope)
B. Decreasing linear:
- Straight line sloping downwards from left to right
- Constant negative rate of change (slope)
C. Increasing exponential:
- Curve increasing rapidly towards positive infinity as x increases
- y-intercept can be positive or negative
D. Decreasing exponential:
- Curve decreasing rapidly towards the x-axis (horizontal asymptote at y=0) as x increases
- y-intercept is positive
- Approaches zero but never touches the x-axis
From this above discussion Option- D is best Fit
Question Easy
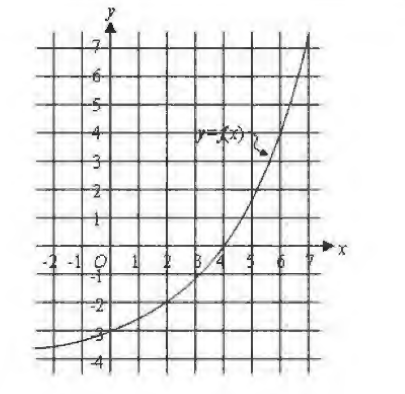
The graph of the exponential function f is shown.
For what value of x is f (x) = 0 ?
A) -4
B) -3
C) 0
D) 4
▶️Answer/Explanation
B) -3

Question Easy
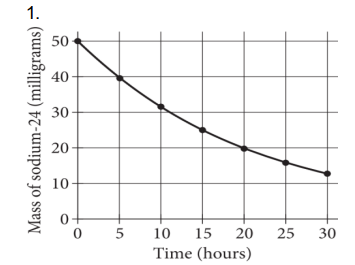
The graph models the radioactive decay of the sodium-24 in a sample over time. According to the graph, at 5 hours, which of the following is closest to the mass, in milligrams, of the sodium-24 in this sample?
A. 25
B. 31
C. 40
D. 50
▶️Answer/Explanation
Ans: C
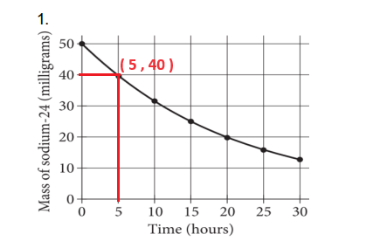
At 5 hours, 40 is closest to the mass, in milligrams, of the sodium-24 in this sample.