Question

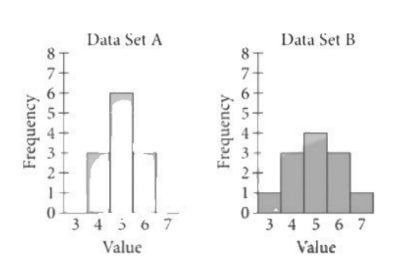
Data sets A and B are summarized in the graphs above. Each data set consists of 12 whole numbers. Which of the following statements must be true?
- Data sets A and B have the same mean, but the standard deviation of data set A is greater than the standard deviation of data set B.
- Data sets A and B have the same mean, but the standard deviation of data set B is greater than the standard deviation of data set A.
- Data sets A and B have the same standard deviation, but the mean of data set A is greater than the mean of data set B.
- Data sets A and B have the same standard deviation, but the mean of data set B is greater than the mean of data set A.
Answer/Explanation
Ans: B
Question

The box plot summarizes the number of seats in the US House of Representatives currently allocated to each of the 50 states. What is the median number of allocated seats in the US House of Representatives?
- 2
- 5
- 10
- 53
Answer/Explanatio
Ans: B
Question
Data set X: 5.50, 5.50, 5.60, 5.65, 5.66
Data set Y: 4.00, 5.50, 5.50, 5.60, 5.65, 5.66
Data sets X and Y show the acidity, or pH, of rainwater samples from two different locations. Which statement about the mean pH of data set X and data set Y is true?
- The mean pH of data set X is greater than the mean pH of data set Y.
- The mean pH of data set X is less than the mean pH of data set Y.
- The mean pH of data set X is equal to the mean pH of data set Y.
- There is not enough information to compare the mean pH of the two data sets.
Answer/Explanation
Ans: A
Question

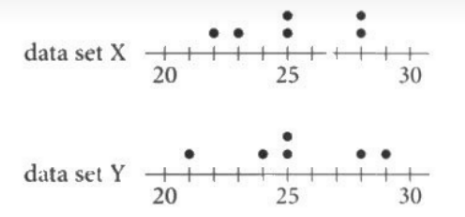
Data set X and data set Y are displayed by the two dot plots shown. Which of the following is(are) the same for both data sets?
1. The mean
2. The median
- I only
- II only
- I and II
- Neither I nor II
Answer/Explanation
Ans: B
Question

The Metropolitan Museum of Art has plates on display from the Roman Empire and ancient Greece. The box plots shown summarize the distributions of the diameters, in centimeters, of all the museum’s plates from each region. How does the median diameter of the plates from the Roman Empire, \(r\), compare to the median diameter of the plates from ancient Greece, \(g\) ?
- \(r\)<\(g\)
- \(r\)>\(g\)
- \(r\)=\(g\)
- There is not enough information to compare the medians.
Answer/Explanation
Ans: A
