Download IITian Academy App for accessing Online Mock Tests and More..

Question
Selected regions of the electromagnetic spectrum are represented in order of increasing frequency below.
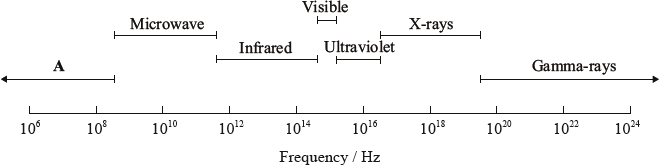
Identify region A.
State which region of the electromagnetic spectrum can be used to identify the functional groups present in a molecule.
Explain why the absorptions in infrared (IR) spectroscopy occur at much higher frequency than those in \(^{\text{1}}{\text{H}}\,{\text{NMR}}\) spectroscopy.
▶️Answer/Explanation
Markscheme
radio(wave);
infrared/IR;
IR involves vibrations of bonds / IR involves shorter wavelength/more energy than \(^{\text{1}}{\text{H}}\,{\text{NMR}}\);
whereas \(^{\text{1}}{\text{H}}\,{\text{NMR}}\) involves transitions between different energy states in the nucleus which are lower in energy / \(^{\text{1}}{\text{H}}\,{\text{NMR}}\) occurs in the radio region therefore energy is lower;
Examiners report
Most candidates were familiar with regions of the electromagnetic spectrum and their uses, but had difficulty describing the relationship between energy and frequency or wavelength.
Most candidates were familiar with regions of the electromagnetic spectrum and their uses, but had difficulty describing the relationship between energy and frequency or wavelength.
Most candidates were familiar with regions of the electromagnetic spectrum and their uses, but had difficulty describing the relationship between energy and frequency or wavelength.
Question
Describe the essential difference between the emission spectrum of sodium and the absorption spectrum of sodium.
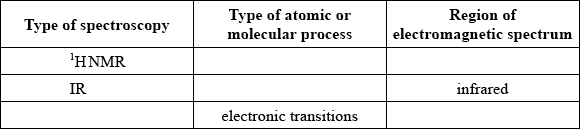
Identify the five missing components in the following table.
▶️Answer/Explanation
Markscheme
Emission spectrum: coloured lines and Absorption spectrum: black/dark lines;
OR
Emission spectrum: lines and Absorption spectrum: continuous;
Allow “Emission spectrum: electrons emit energy as they drop to lower energy levels and Absorption spectrum: electrons absorb energy as they are promoted to higher energy levels” / OWTTE.
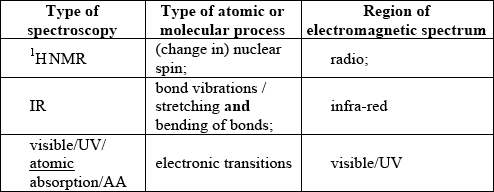 ;
;
For M4 both visible/UV/atomic absorption/AA for type of spectroscopy and region of EMS required.
Examiners report
Students found it difficult to explain clearly the difference between emission and absorption spectra for part (a). Most candidates successful in gaining the mark, described the difference in terms of energy released or absorbed by the electrons. There was lack of understanding however for the difference in the coloured and the dark lines produced by the two spectra. Candidates who described the difference in terms of coloured lines or continuous spectrum had difficulty attaining the mark. Very few students achieved all 4 points for part (b). Most had difficulty completing the information for \(^{\text{1}}{\text{H}}\,{\text{NMR}}\). Many stated a number for what was measured instead of the atomic/molecular process e.g. chemical shift as opposed to nuclear spin. Candidates were well prepared for answering part (c) often, stating concentration of the element as the answer.
Students found it difficult to explain clearly the difference between emission and absorption spectra for part (a). Most candidates successful in gaining the mark, described the difference in terms of energy released or absorbed by the electrons. There was lack of understanding however for the difference in the coloured and the dark lines produced by the two spectra. Candidates who described the difference in terms of coloured lines or continuous spectrum had difficulty attaining the mark. Very few students achieved all 4 points for part (b). Most had difficulty completing the information for \(^{\text{1}}{\text{H}}\,{\text{NMR}}\). Many stated a number for what was measured instead of the atomic/molecular process e.g. chemical shift as opposed to nuclear spin. Candidates were well prepared for answering part (c) often, stating concentration of the element as the answer.