▶️ Answer/Explanation
(a) Sketch the curve:
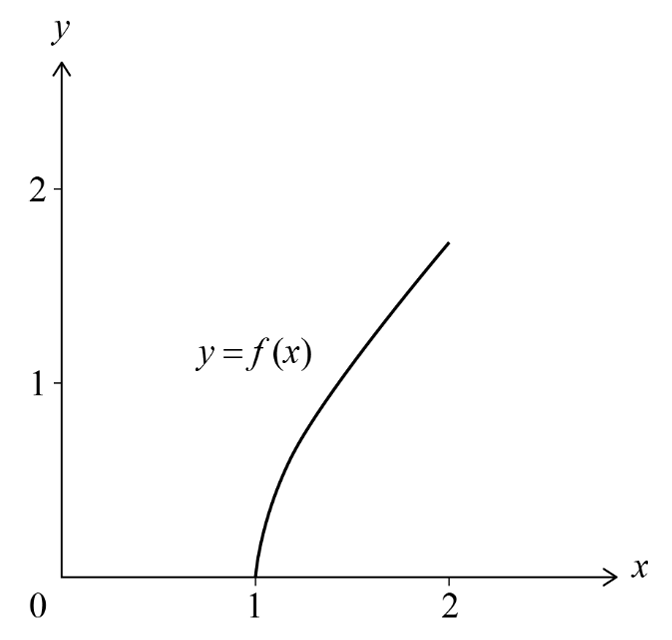
Endpoints Analysis:
– At \( x = 1 \): \( f(1) = \sqrt{1^2 – 1} = \sqrt{0} = 0 \) → Point at (1, 0)
– At \( x = 2 \): \( f(2) = \sqrt{2^2 – 1} = \sqrt{3} ≈ 1.732 \) → Point at (2, √3)
Curve Characteristics:
1. Derivative Analysis:
\( f'(x) = \frac{x}{\sqrt{x^2 – 1}} > 0 \) for all \( x \) in (1,2] → Function is strictly increasing
2. Second Derivative:
\( f”(x) = -\frac{1}{(x^2 – 1)^{3/2}} < 0 \) → Curve is concave downward
3. Behavior at Endpoints:
Vertical tangent at x=1 (derivative approaches infinity)
Gradual increase to (2,√3)
(b) (i) Inverse Function Derivation:
Step-by-Step Solution:
1. Start with original function: \( y = \sqrt{x^2 – 1} \)
2. Square both sides: \( y^2 = x^2 – 1 \)
3. Rearrange: \( x^2 = y^2 + 1 \)
4. Solve for x: \( x = \sqrt{y^2 + 1} \) (we take positive root since x ≥ 1)
Verification:
\( f(f^{-1}(x)) = \sqrt{(\sqrt{x^2 + 1})^2 – 1} = \sqrt{x^2 + 1 – 1} = x \) ✓
\( f^{-1}(f(x)) = \sqrt{(\sqrt{x^2 – 1})^2 + 1} = \sqrt{x^2 – 1 + 1} = x \) ✓
(b) (ii) Domain and Range Analysis:
Domain of f⁻¹:
– Original function range: f(x) goes from 0 to √3
– Therefore domain of f⁻¹: [0, √3]
Range of f⁻¹:
– Original function domain: [1, 2]
– Therefore range of f⁻¹: [1, 2]
Visual Confirmation:
The inverse function “undoes” the original function, swapping domain and range
(c) (i) Volume Derivation:
Disk Method Application:
1. For rotation about y-axis: \( V = π∫x^2 dy \)
2. From part (b): \( x^2 = y^2 + 1 \)
3. Set up integral from y=0 to y=h:
\( V = π∫_0^h (y^2 + 1) dy \)
4. Evaluate integral:
\( = π[\frac{1}{3}y^3 + y]_0^h \)
5. Final expression:
\( V = π(\frac{1}{3}h^3 + h) \)
Physical Interpretation:
The volume consists of:
– A cubic term (⅓h³) representing the curved part
– A linear term (h) representing the cylindrical part
(c) (ii) Maximum Volume Calculation:
Step-by-Step:
1. Determine maximum height (h_max):
\( h_{max} = f(2) = √3 \)
2. Substitute into volume formula:
\( V_{max} = π(\frac{1}{3}(√3)^3 + √3) \)
3. Simplify:
\( (√3)^3 = 3√3 \)
\( \frac{1}{3} × 3√3 = √3 \)
\( V_{max} = π(√3 + √3) = 2π√3 \) m³
Numerical Value:
\( 2π√3 ≈ 10.88 \) m³
(d) Time Calculation:
Given:
– Filling rate: 0.4 m³/s
– Total volume: 2π√3 m³
Calculation:
\( t = \frac{V_{max}}{rate} = \frac{2π√3}{0.4} = 5π√3 \) seconds
Numerical Value:
\( 5π√3 ≈ 27.2 \) seconds
Practical Interpretation:
It would take approximately 27.2 seconds to completely fill the container at the given rate
(e) Rate of Height Change:
Part 1: Find h at half volume
1. Half volume: \( V_{half} = π√3 \)
2. Solve \( π(\frac{1}{3}h^3 + h) = π√3 \)
3. Simplify: \( \frac{1}{3}h^3 + h – √3 = 0 \)
4. Numerical solution (Newton-Raphson method):
– Try h ≈ 1.18: \( \frac{1}{3}(1.18)^3 + 1.18 ≈ 1.732 ≈ √3 \) ✓
Part 2: Calculate dh/dt
1. Differentiate volume formula:
\( \frac{dV}{dh} = π(h^2 + 1) \)
2. Given \( \frac{dV}{dt} = 0.4 \) m³/s
3. By chain rule: \( \frac{dh}{dt} = \frac{dV/dt}{dV/dh} = \frac{0.4}{π(h^2 + 1)} \)
4. Substitute h ≈ 1.18:
\( \frac{dh}{dt} ≈ \frac{0.4}{π(1.18^2 + 1)} ≈ \frac{0.4}{7.505} ≈ 0.0533 \) m/s
Interpretation:
When the container is half full, the water level rises at about 5.33 cm per second