IB MYP 4-5 Biology Chapter 5 : Movement–Practice Questions

Question:

What are the units of wind speed?

▶️Answer/Explanation

Ans: Meters per second (m s1).

Question:

Discuss the concept of movement in relation to this experiment.

▶️Answer/Explanation

Ans: Wind is moving air; transpiration is movement of water molecules from the plant to the atmosphere; water lost by transpiration is replaced within the plant by water moving up the xylem; water uptake by the plant causes water movement in the photometer.

Question:

Transpiration rates are not as high as expected when fans blow air at very high speeds: have you noticed this? Suggest a testable hypothesis that could be investigated to explain this observation.

▶️Answer/Explanation

Ans: Stomata close to prevent/reduce water loss by transpiration at high wind speeds.

Question:

Estimate the mean length of the:

a) longest leaves for a 90 m tree

▶️Answer/Explanation

Ans: 150 250 millimetres

b) shortest leaves for a 90 m tree

▶️Answer/Explanation

Ans: 40 50 millimetres

c) longest leaves for a 20 m tree

▶️Answer/Explanation

Ans: 700 – 740 millimetres

d) shortest leaves for a 20 m tree.

▶️Answer/Explanation

Ans: 10 – 12 millimetres

Question:

As the height of the tree increases, outline what happens to:

a) the maximum leaf length

▶️Answer/Explanation

Ans: Maximum leaf length decreases.

b) the minimum leaf length

▶️Answer/Explanation

Ans: Minimum leaf length increases.

c) the variability in leaf length.

▶️Answer/Explanation

Ans: Variation in leaf length decreases.

Question:

Explain what limits the rate at which carbohydrates can be carried away from the leaves.

▶️Answer/Explanation

Ans: Amount of phloem tissue; pressure gradient in phloem between source and sink; availability of water for producing phloem sap/for dissolving sugars produced by photosynthesis.

Question:

With reference to photosynthesis and transpiration, state one advantage and one disadvantage of a large surface area leaf.

▶️Answer/Explanation

Ans: More light collected for photosynthesis by a large leaf; more surface area over which carbon dioxide can be absorbed for photosynthesis; more water loss by transpiration from a large leaf.

Question:

Does the data in the graph suggest that there is a limit to tree height? 

▶️Answer/Explanation

Ans: Data in the graph suggests that there is a maximum height for trees; because the lines for maximum and minimum leaf length will meet; at about 110 meters; and above that the lines would
cross implying that there is no viable leaf length.

Question:

Compare and contrast the changes in exhaled breath pH caused by walking through Hyde Park and along Oxford Street. Explain these results.

▶️Answer/Explanation

Ans: pH changed after walking both along Oxford Street and through Hyde Park; pH increases after walks in Hyde Park and decreases after walks along Oxford Street; 3 hours is one hour after exercise was completed. Hyde Park walkers are in oxygen debt recovery mode; so ventilation is raised and carbon dioxide levels in exhaled breath are therefore particularly low; Oxford St. walkers are still working to release carbon dioxide buildup from the twohour walk.

Question:

Calculate the percentage increase of myeloperoxidase between Hyde Park and Oxford Street for participants.

▶️Answer/Explanation

Ans: [(43 6)/6] × 100% = 617%

Question:

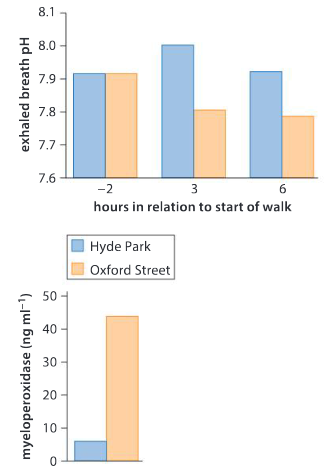
Explain the myeloperoxidase results and deduce a conclusion that is supported by this data.

▶️Answer/Explanation

Ans: Breathing polluted air on Oxford Street causes swelling (of airways/bronchioles); making ventilation/gas exchange more difficult; so carbon dioxide concentrations in the lungs increase; and exhaled air contains higher carbon dioxide concentrations; converse for Hyde Park.

Question:

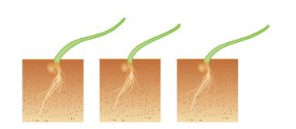
The diagrams shown below illustrate the curvature of three seedlings after eight hours. Explain why Darwin measured three shoots rather than one.

▶️Answer/Explanation

Ans: [(473 324)/473] × 100% = 31.5%

Question:

The graph shows average shoot curvature over time.

a) What was the time delay before the shoots start to curve towards the light?

▶️Answer/Explanation

Ans: 20 minutes

b) At what time was the shoot curving most rapidly?

▶️Answer/Explanation

Ans:  60 70 minutes

c) Describe the pattern of shoot curvature shown in the graph.

▶️Answer/Explanation

Ans: Sigmoid curve; no increase until 20 minutes after light stimulus; then increasingly rapid curvature; until 70 minutes after which curvature slows; little more curvature after 140 minutes.

Question:

a) If a small aluminium foil cap is placed over the top of the shoots, they do not respond to unilateral light. What do you conclude from this?

▶️Answer/Explanation

Ans: The top of the shoot detects the light stimulus.

b) Predict the response if the shoots were kept in the dark.

▶️Answer/Explanation

Ans: No curvature; upwards growth away from gravity; rapid growth to try to reach light.

c) If Darwin’s experiment is repeated with different wavelengths of unidirectional light, there is little or no response with some wavelengths but a strong response with blue (450 nm) wavelengths. What conclusions can you draw from this?

▶️Answer/Explanation

Ans: Only absorption of blue light causes phototropism; the pigment absorbing the blue light will be red in colour.

Summative assessment

Water evaporation in forests

Question:

The data below shows the annual rate of water evaporation per square metre from forests of different ages and different types.

a) State the rate of evaporation from a 60-year-old pine forest.

▶️Answer/Explanation

Ans: 530 mm yr–1

b) Calculate the mean evaporation rate for each age of forest, using the data from all forest types. Construct a graph to display these mean evaporation rates.

▶️Answer/Explanation

Ans: 40 years: 557;
60 years: 563;

100 years: 470;

140 years: 433.

Plot a line graph with all points plotted correctly; xaxis for age with suitable scale and legend; yaxis for evaporation rate with suitable scale and legend.

c) Outline the trends in the data displayed in the graph.

▶️Answer/Explanation

Ans: For example, with birch and aspen, evaporation rate increases until 60 years old; then decreases slightly.

d) Suggest reasons for these trends. 

▶️Answer/Explanation

Ans: Surface area of leaves/leaf area index increases as forest grows older; more transpiration with more leaf area; decrease in evaporation in oldest forests due to loss of ground flora/decrease in water transport to the top of tall trees/slower water transport in older wood.

e) Summarize the types and causes of water movement in the water cycle in a forest ecosystem

▶️Answer/Explanation

Ans: Water uptake by trees; loss of water from trees by transpiration; evaporation of water from soil/trunks/rocks/surfaces; rainfall; percolation of water into soils; drainage of water through soil.

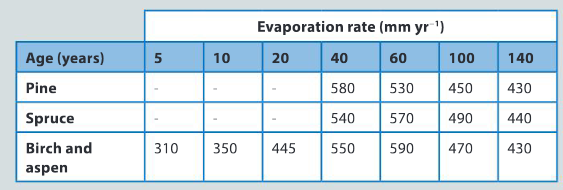
Source of data: http://archive.unu.edu/unupress/unupbooks/80635e/80635E0d.htm

Factors affecting the rate of transpiration

You can make a simple apparatus for measuring the rate of transpiration by placing a cutting from a tree such as beech or sycamore in water. Cover the surface of the water with vegetable oil to prevent evaporation.
The rate of change in the mass of the system will be a measure of the rate of transpiration, so you will need to take careful measurements as the mass changes may be small (at the level of milligrams).

Question:

Describe a method for investigating the effect on transpiration of one environmental variable. Possible variables are: amount of light, speed of air flow from a fan and area of leaves attached to the stem. In your method, include details of how you propose to measure the rate of transpiration with accuracy and precision.

▶️Answer/Explanation

Ans: Design should include clear statement of independent, dependent and control variables, rationale for the method and practical details, consideration of ethics and risks, with marks awarded on a scale from 0 marks for a completely inadequate design to eight marks for an exemplary design.

Question:

Evaluate the apparatus you are using, which is known as a mass potometer.

▶️Answer/Explanation

Ans: Evaluation should state clearly to what extent the method allowed transpiration to be measured with accuracy and precision, whether it allowed the dependent variable to be controlled effectively and whether other variables were successfully controlled, with marks awarded on a scale of 0 marks for an incorrect/invalid evaluation to 5 marks for a convincing evaluation of the method.

Transpiration and the Makarieva and Gorshkov hypothesis

The yellow line approximately encloses the Atlantic Forest distribution

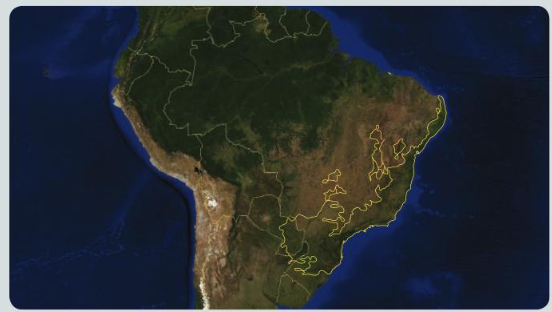
The Atlantic Forest follows the coast of Brazil and also covers a small part of Paraguay and Argentina.
Water evaporating from the Atlantic Forest in Brazil is carried by upward air currents to heights where it is cool enough for the water vapor to condense. Much of the condensed water falls to the ground as rain and can then evaporate again.
When water vapor condenses, there is a drop in atmospheric pressure, because the water occupies much less volume as a liquid than a gas. Low pressure in areas of high evaporation therefore
creates winds that draw air in from areas of less evaporation.

Question:

Explain how clearance of forests could reduce rainfall in areas such as the Atlantic Forest of Brazil.

▶️Answer/Explanation

Ans: Less transpiration; less water vapour/humidity in atmosphere; less water vapour carried up to heights in the atmosphere where it is cooled; less water vapour condensing and therefore falling as rain; less drop in atmospheric pressure; less wind bringing in dry air that can evaporate more water.

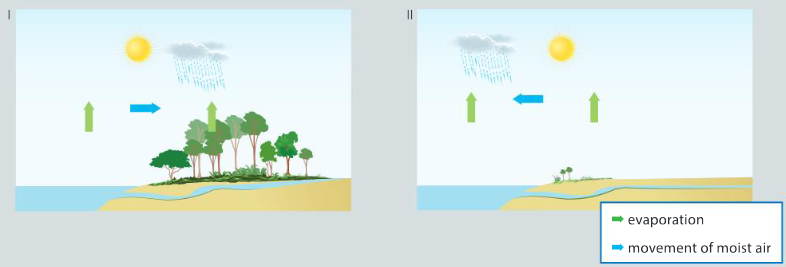
In tropical forests such as the Atlantic Forest there is high rainfall and river flow rates. The “biotic pump” hypothesis has been developed by Makarieva and Gorshkov to explain how plants within these forests could increase rainfall and river flows. The diagrams shown on the next page illustrate the hypothesis. Diagram I shows forest adjacent to ocean and diagram II shows desert adjacent to ocean. 

Question:

Using scientific reasoning, formulate a hypothesis for whether there will be more evaporation from the intact Atlantic Forest of Brazil, or from the surface of the Atlantic Ocean off the coast of
Brazil. 

▶️Answer/Explanation

Ans: More evaporation from forest; larger total surface area from which water can evaporate; many leaves; large area of spongy mesophyll inside leaves; water only evaporates from the surface of an ocean; leaves at higher temperature than ocean surface; more heat energy for evaporation.

Question:

Using your scientific knowledge, explain how plants can increase rainfall and river flows according to the “biotic pump” hypothesis.

▶️Answer/Explanation

Ans: Water lost from forest by transpiration; warm air from forest rises; water vapour condenses as air cools on rising; condensed water falls as rain; drop in pressure due to condensation draws in winds from the adjacent ocean; so rain falls upstream of where water is lost by transpiration; increasing river flows.

According to the biotic pump hypothesis, clearance of the Atlantic Forest of Brazil will not only reduce rainfall in that forest, but also in the Amazonian rainforests to the west. Diagram III illustrates the effect of forest clearance on a coastal forest and diagram IV the effect of continuous forest cover across a continent.

Question:

Explain what data you would want to collect in a scientific investigation aimed at testing the hypothesis that clearance of the Atlantic Forest of Brazil will reduce rainfall and so threaten the
Amazonian rainforest.

▶️Answer/Explanation

Ans: Rates of transpiration; convection currents; air pressures; cloud density; rainfall; wind speed; wind direction; river flow rates; for areas of intact rainforest; and areas where forest has been cleared.

Question:

Discuss whether the further clearance of Atlantic Forest is justified for purposes of expansion of towns and cities, development of new industries, increased cattle farming or the growth of sugar-cane, coffee, tea, tobacco and biofuel crops. Try to reach scientifically supported judgments. Consider the global context of fairness and development in your discussion.

▶️Answer/Explanation

Ans: Discussion should include arguments for and against urbanization and development of agriculture that are based on science and the global context of fairness and development, with marks awarded on a scale from 0 marks for a discussion with no useful content to 10 marks for an exemplary discussion with many detailed arguments and convincing overall balance.

Scroll to Top