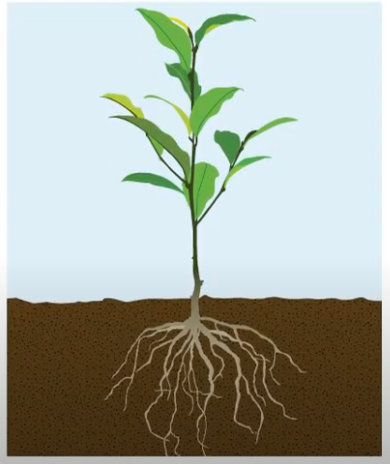
IB MYP Biology : Metabolism – movement and transport Practice Question

IB myp 4-5 Biology – Practice Questions- All Topics

Topic :Metabolism-movement and transport

Topic :Metabolism– Weightage : 21 % 

All Questions for Topic : Nutrition,Digestion,Biochemistry and enzymes,Movement and transport,Diffusion,Osmosis,Gas exchange,Circulation,Transpiration and Translocation,Homeostasis

Question

6 Design an investigation to test how changing the length of a Cabomba stem affects the rate of photosynthesis. You are provided with standard laboratory equipment. In your answer, you should include:(15 marks)

  • the independent variable, dependent variable and two control variables
  •  a testable hypothesis
  •  equipment you will use
  •  details of how to manipulate, measure or monitor the variables
  • details of the method to collect sufficient data.

The enzyme that catalyses the photosynthesis reaction is called rubisco. Enzymes are affected by different factors, including temperature and concentration of substrate.
a .The diagram below illustrates an enzyme-catalysed reaction. Identify the enzyme, the substrate and the product.(2 marks)

▶️Answer/Explanation

Ans:

For the investigation on how changing the length of a Cabomba stem affects the rate of photosynthesis, here are the details:

Independent variable: Length of the Cabomba stem,

Dependent variable: Rate of photosynthesis
Control variables: Light intensity and concentration of carbon dioxide

Testable hypothesis: If the length of the Cabomba stem increases, then the rate of photosynthesis will also increase.

Equipment:
 Cabomba stems of different lengths, light source (lamp or sunlight), carbon dioxide source (soda lime or carbon dioxide gas), beakers or containers, water, timer or stopwatch, pH indicator solution.

Procedure:
1. Set up the experimental conditions with the same light intensity and carbon dioxide concentration.
2. Cut Cabomba stems into different lengths (e.g., short, medium, long).
3. Place each Cabomba stem in a separate beaker or container filled with water.
4. Start the timer and measure the initial rate of photosynthesis by counting the number of oxygen bubbles released by the Cabomba stem in a specific time period (e.g., 5 minutes).
5. Repeat the experiment for each length of the Cabomba stem, ensuring the same time duration and measuring the rate of photosynthesis.
6. Record the data and analyze the relationship between the length of the Cabomba stem and the rate of photosynthesis.

By collecting data on the rate of photosynthesis for different lengths of Cabomba stems, you can determine if there is a correlation between the length of the stem and the rate of photosynthesis.

In the diagram, the enzyme is rubisco, the substrate is carbon dioxide (CO2), and the product is glucose (C6H12O6).

Question

6b .The graph below shows what happens to the rate of an enzyme-catalysed reaction when the substrate concentration changes. All other variables were controlled.(4 marks)

Interpret the graph and explain the trend between each set of points.
Between points \(A\) and \(B\)

Between points \(B\) and \(C\)

▶️Answer/Explanation

Ans:

Between points A and B, as the substrate concentration increases, the rate of the enzyme-catalyzed reaction also increases. This indicates that the reaction rate is directly proportional to the substrate concentration.

Between points B and C, the rate of the reaction reaches a maximum and levels off, even though the substrate concentration continues to increase. This suggests that the enzyme has reached its maximum capacity and adding more substrate does not further increase the reaction rate.

Scroll to Top