
▶️ Answer/Explanation
(a) (i)
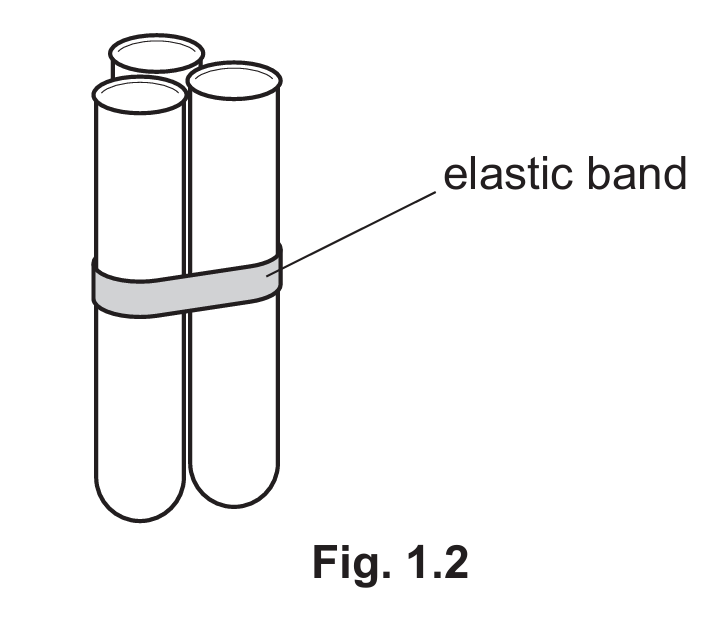
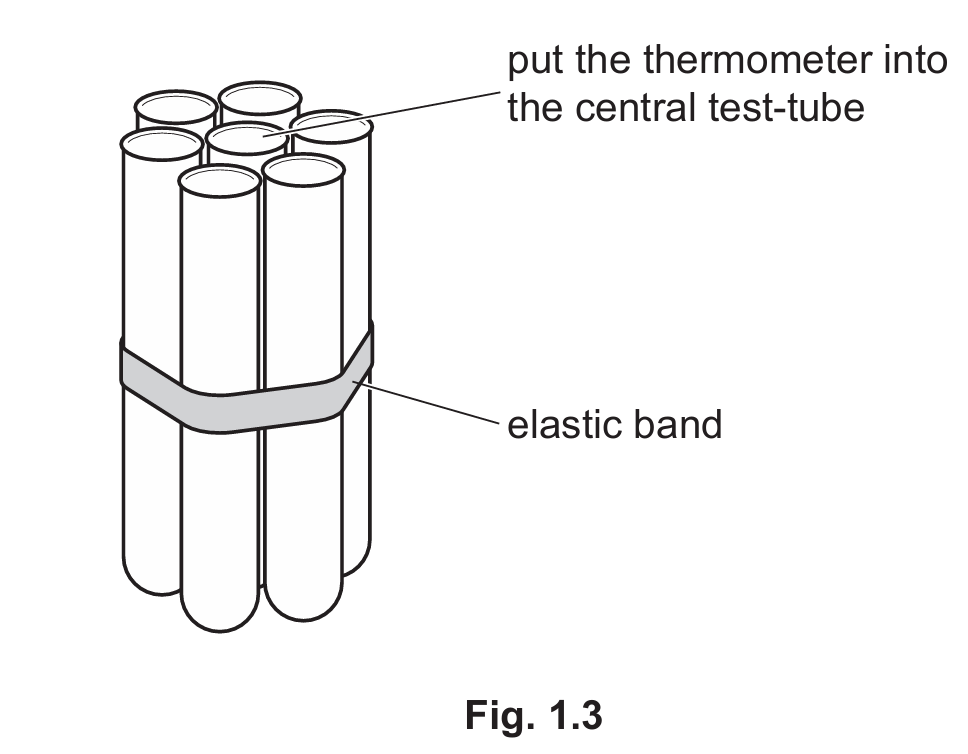
The table should have columns for Time (minutes), Temperature for 1 test-tube (°C), Temperature for 3 test-tubes (°C), and Temperature for 7 test-tubes (°C). It should include rows for measurements at 0, 1, 2, 3, 4, and 5 minutes.
Explanation: A well-designed table is crucial for recording experimental data. It should have clear headings with units and enough rows to record all measurements. The temperature should be recorded for each configuration (1, 3, and 7 test-tubes) at each time interval.
(a) (ii)
Plot temperature on the y-axis (with units °C) and time on the x-axis (with units minutes). Use different line styles or colors for each test-tube configuration and include a key.
Explanation: The graph should clearly show how temperature changes over time for each group of test-tubes. The key helps distinguish between the different experimental conditions. The axes should be properly labeled with units.
(a) (iii)
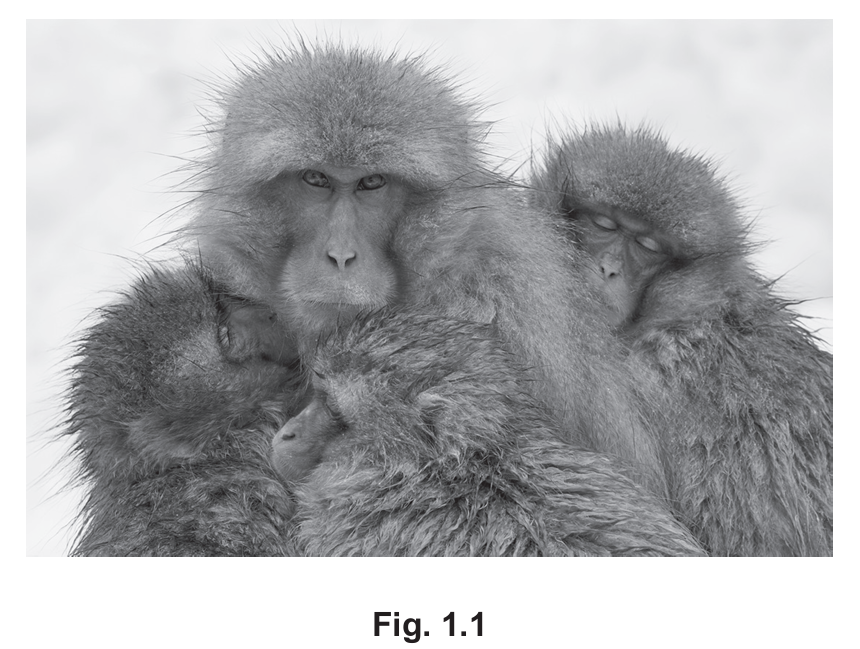
1. Huddling reduces heat loss (more test-tubes lose heat more slowly).
2. As time increases, temperature decreases in all configurations.
Explanation: These conclusions are drawn from the expected results where grouped test-tubes would lose heat more slowly than single ones due to reduced surface area exposed to the environment.
(a) (iv)
1. Size/type of test-tubes was kept constant.
2. Total experimental time was kept constant.
Explanation: Controlling variables is essential for a fair test. Other variables that should be constant include starting temperature, volume of water, and environmental conditions.
(a) (v)
1. Volume of water might not be exactly the same in all test-tubes.
2. Starting temperature might vary between trials.
Explanation: Potential errors include measurement inaccuracies, inconsistent water volumes, or temperature fluctuations. These could affect the reliability of the results.
(a) (vi)
Repeat the investigation multiple times to calculate mean values.
Explanation: Repeating the experiment helps identify anomalies and increases the reliability of the results by reducing the impact of random errors.
(a) (vii)
Risk of burns from hot water or broken glass.
Explanation: Safety considerations are important in any experiment involving heat and glassware. Proper handling and protective equipment should be used.
(b)
Plan should include:
1. Independent variable: Different temperatures (e.g., 20°C, 30°C, 40°C, 50°C, 60°C)
2. Dependent variable: Time for starch to disappear (using iodine test) or time for reducing sugars to appear (using Benedict’s test)
3. Controlled variables: Volume/concentration of amylase and starch, pH
4. Method: Mix amylase and starch at each temperature, test samples at regular intervals
5. Safety: Use water baths for temperature control, wear goggles
Explanation: A good investigation plan identifies all key variables and describes a clear method. The temperature range should cover the expected optimum (around 37°C for human enzymes). Testing at regular intervals allows observation of the reaction rate. Safety precautions are essential when working with hot water baths.
▶️ Answer/Explanation
(a)(i) To get a representative sample / to avoid bias / to identify or exclude anomalies / to increase confidence in results.
Explanation: Sampling a large number of plants (100 in this case) helps ensure the data is representative of the entire population. This reduces the impact of individual variations or outliers and increases the reliability of the results. It’s a fundamental principle in biological studies to use adequate sample sizes for meaningful conclusions.
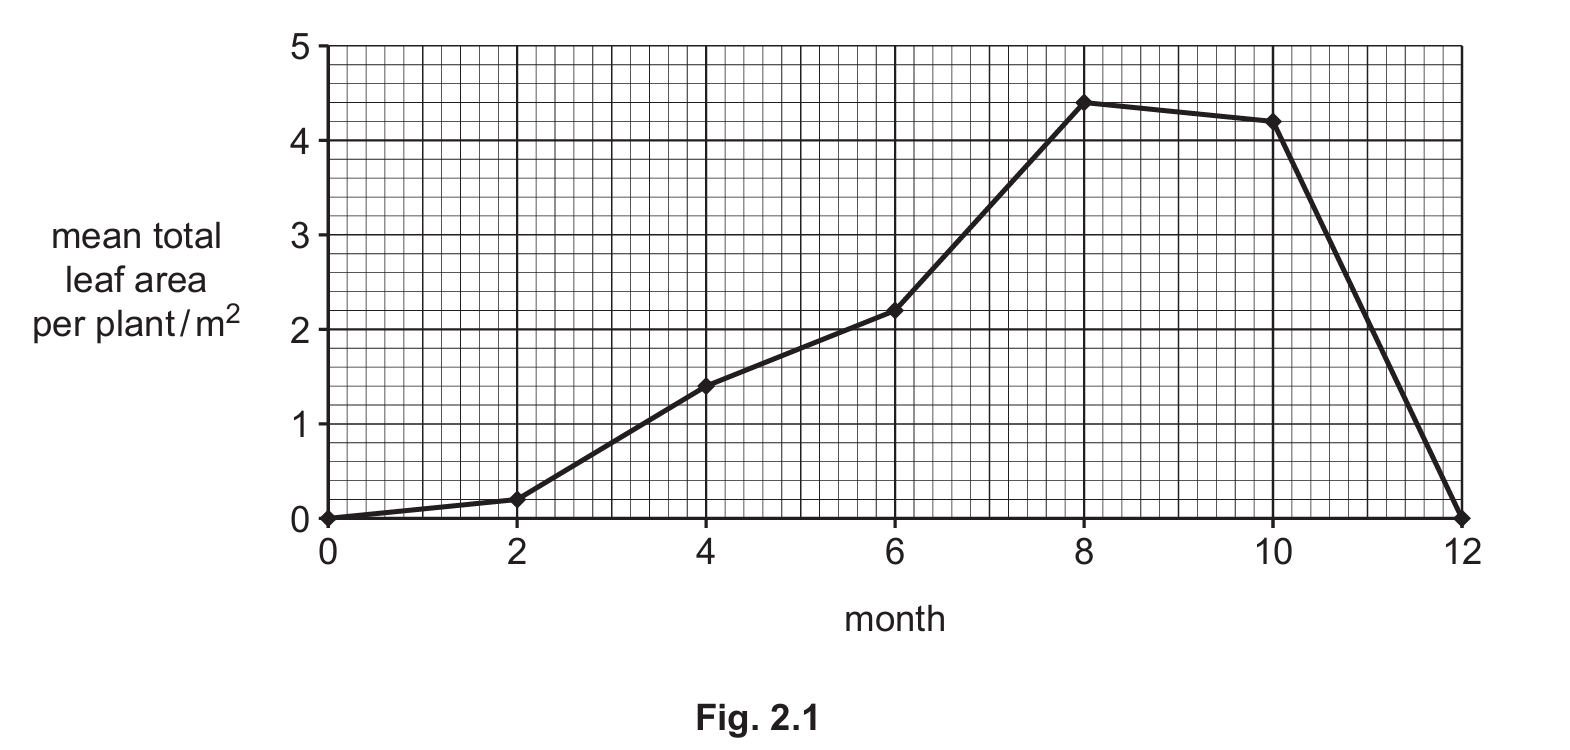
(a)(ii) 3.3 m² (accept values between 3.2-3.4 m²).
Explanation: To estimate the value for month 7, you would locate month 7 on the x-axis, follow it up to the curve, then read across to the y-axis. The graph shows the value is approximately halfway between 3.0 and 3.5 m², hence 3.3 m² is a reasonable estimate.
(a)(iii) 57%
Explanation: From the graph, month 4 shows ~1.4 m² and month 6 shows ~2.2 m². The increase is 0.8 m². Percentage increase = (Increase/Original) × 100 = (0.8/1.4) × 100 = 57.14%, which rounds to 57% to two significant figures.
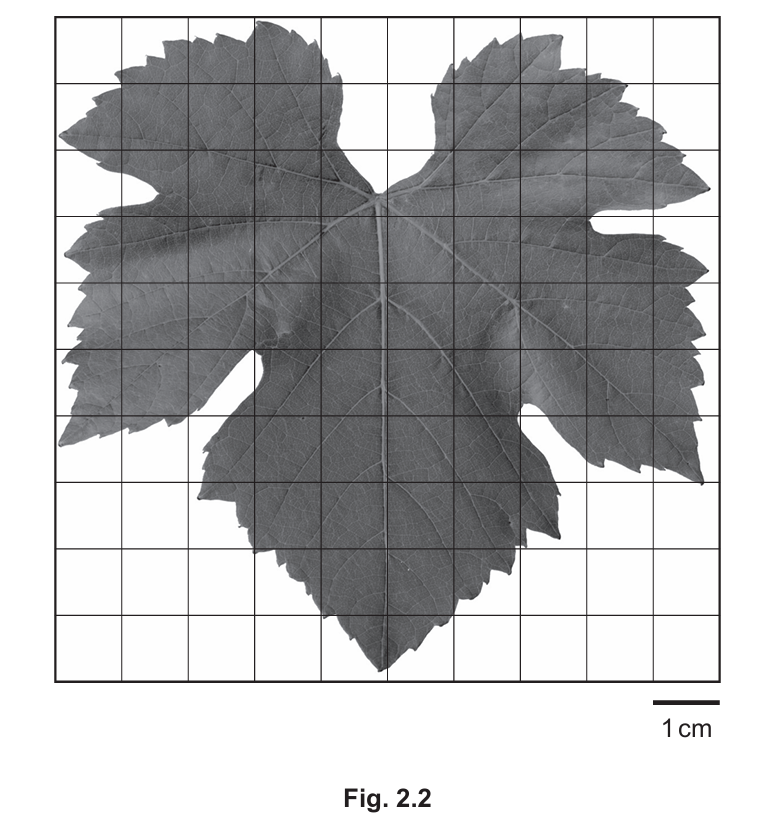
(b) 59 cm² (accept 55-66 cm²)
Explanation: To calculate the area, count all grid squares that are more than half-covered by the leaf. Each square represents 1 cm². The exact count may vary slightly depending on interpretation, but should fall within the 55-66 cm² range.
(c) Method: Add Benedict’s reagent to the sample and heat it. Positive test: Color change to green/yellow/orange/red/brown.
Explanation: Benedict’s test is used to detect reducing sugars. When heated with Benedict’s solution, reducing sugars will cause a color change from blue through green, yellow, orange to brick red, depending on the concentration of reducing sugars present. The precipitate formed is copper(I) oxide.
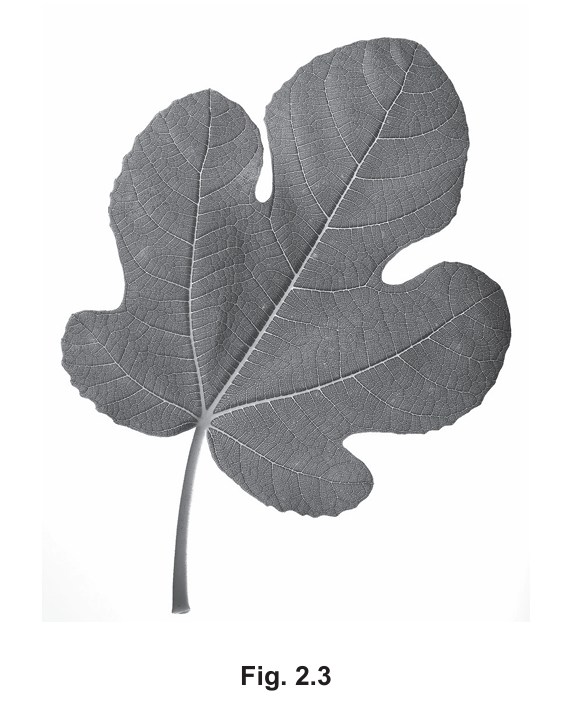
(d) The drawing should show:
- A clear outline of the entire leaf (single unbroken line)
- Size at least 65mm wide
- Five distinct lobes
- One main vein visible in each lobe
Explanation: Biological drawings should be large, clear and show all relevant features. The fig leaf has five distinct lobes with visible venation. The drawing should be proportional and show these key features accurately without shading or coloring.
(e) Similarity: Both leaves are lobed/have veins/have uneven edges. Difference: Grapevine leaf has serrated edges while fig leaf has smooth edges / Grapevine leaf lacks a petiole while fig leaf has one.
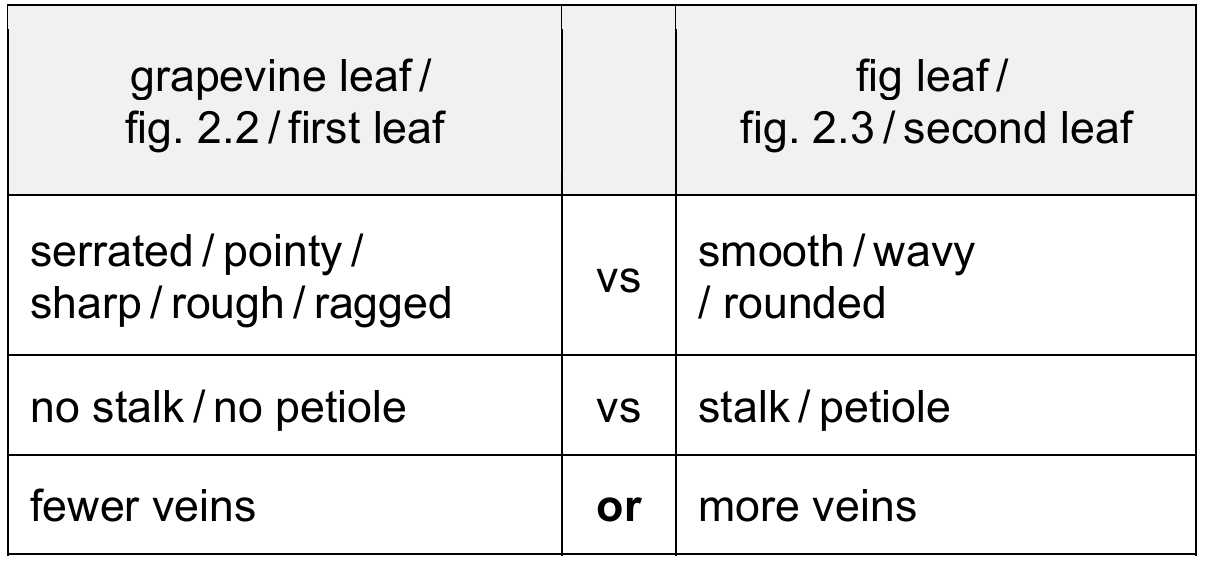
Explanation: Both leaves show the common dicotyledonous feature of being lobed with visible venation. The main differences are in the edge texture (grapevine leaves are famously serrated while fig leaves are smooth) and the presence of a petiole (leaf stalk) which is clearly visible in the fig leaf but not in the grapevine leaf shown.