▶️ Answer/Explanation
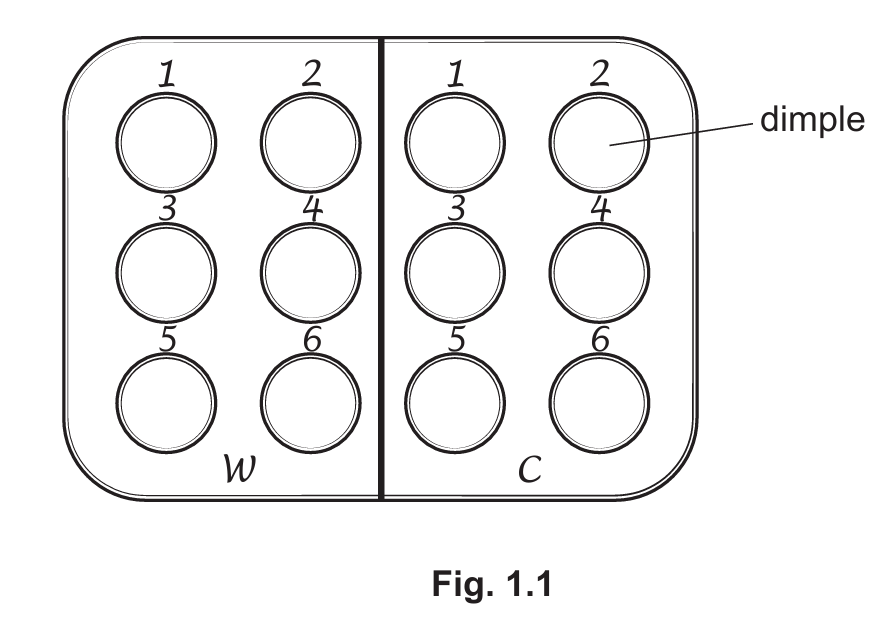
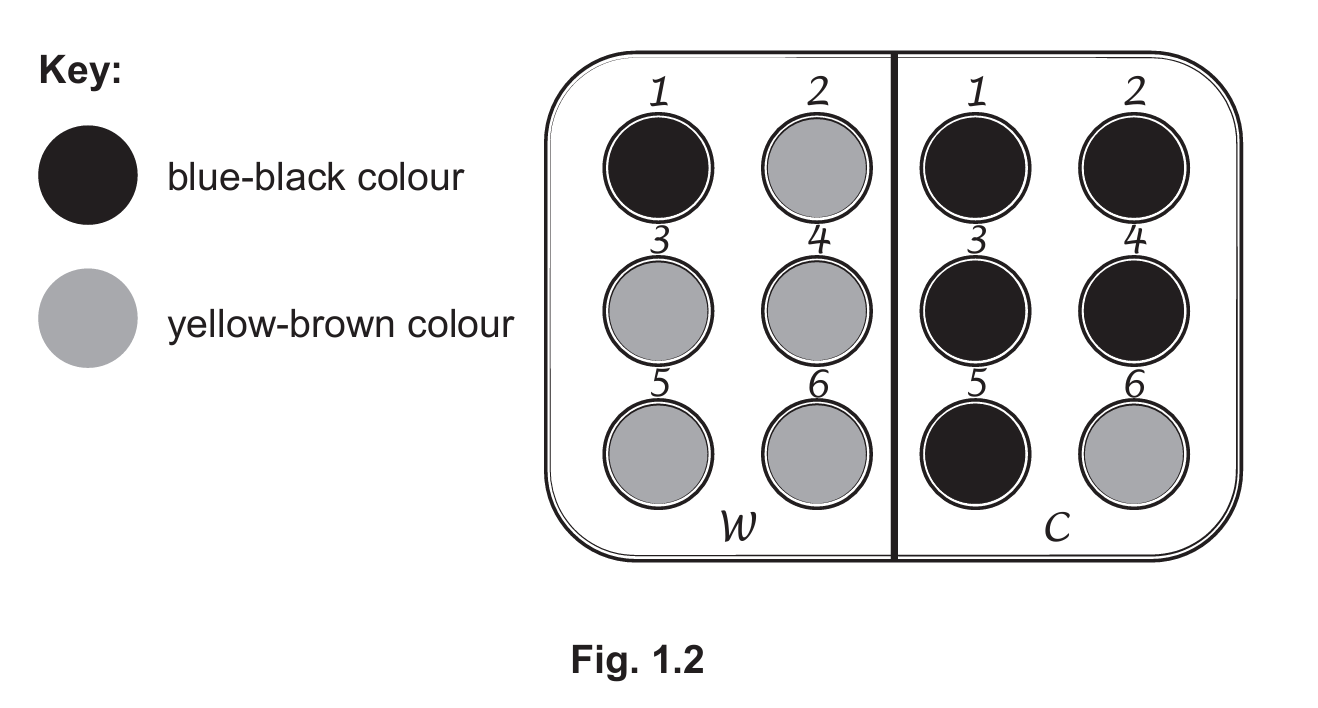
(a)(i) Table of results:
| Dimple | Warm water (W) | Cold water (C) |
|---|---|---|
| 1 | blue-black | blue-black |
| 2 | blue-black | blue-black |
| 3 | yellow-brown | blue-black |
| 4 | yellow-brown | blue-black |
| 5 | yellow-brown | blue-black |
| 6 | yellow-brown | blue-black |
Explanation: The table should have clear headings for each column (Dimple, Warm water, Cold water) and accurately record the color changes observed in each dimple. The warm water samples show a quicker change from blue-black to yellow-brown, indicating faster starch breakdown at higher temperatures.
(a)(ii) Conclusion: The higher temperature (warm water) resulted in faster breakdown of starch by amylase compared to the lower temperature (cold water).
Explanation: The color change from blue-black to yellow-brown occurs sooner in the warm water samples, showing that enzyme activity is temperature-dependent and works faster at higher temperatures within its optimal range.
(a)(iii) Independent variable: Temperature (of the water in the beakers).
Explanation: This is the variable that was deliberately changed (warm vs. cold water) to observe its effect on the enzyme activity.
(a)(iv) Controlled variables (any three):
- Number of drops of iodine solution used
- Volume of amylase solution (2 cm³)
- Concentration of amylase solution (2%)
- Volume of starch suspension (2 cm³)
- Time intervals between sampling (30 seconds)
- Number of drops of sample added to iodine solution
Explanation: These variables were kept constant to ensure that any changes observed in the rate of starch breakdown were solely due to the temperature difference and not other factors.
(b)(i) Limitation of method: The color change might occur between sampling times, making it difficult to pinpoint the exact time of complete starch breakdown.
Explanation: Since samples are only taken every 30 seconds, the precise moment when all starch is broken down could be missed. The method provides approximate rather than exact timing.
(b)(ii) Improving temperature control: Use a thermostatically controlled water bath to maintain a constant temperature throughout the experiment.
Explanation: The warm water in the beaker would naturally cool over time, affecting enzyme activity. A water bath with temperature control would eliminate this source of error by maintaining a stable temperature.
(b)(iii) Reason for 3-minute wait: To allow the test-tube contents to reach the same temperature as the water in the beaker (thermal equilibration).
Explanation: This waiting period ensures that both the enzyme solution and starch suspension are at the intended experimental temperature before mixing, making the results more reliable and comparable.

▶️ Answer/Explanation
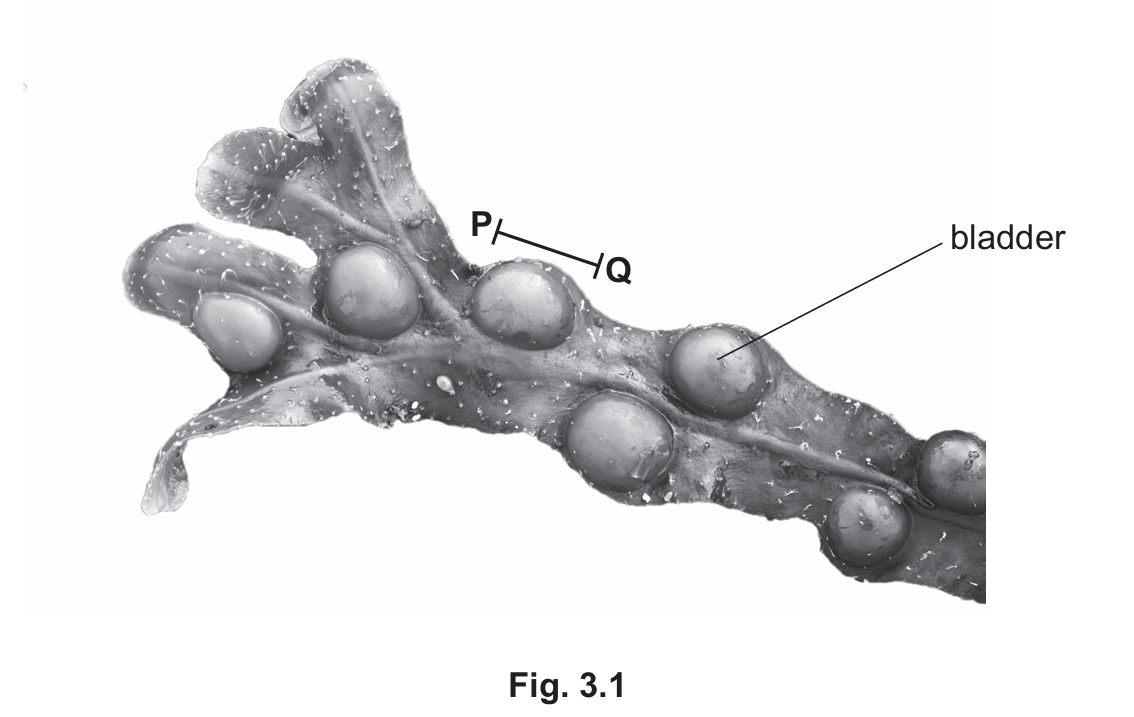
(a) (i)
Answer: The diagram should have:
- A single clear outline with no shading
- Frond length at least 114 mm
- 7 bladders drawn
- Central midrib shown as a double line at least up to the point where it branches
(a) (ii)
Answer:
Measured length of line PQ: 12 mm (accept 11-13 mm)
Magnification calculation: \[ \frac{12}{19} = 0.63 \] (to two decimal places)
Explanation: First, measure line PQ carefully using a ruler. The actual length is given as 19 mm. Magnification is calculated by dividing the measured length by the actual length. Here, 12 mm ÷ 19 mm = 0.63 when rounded to two decimal places.
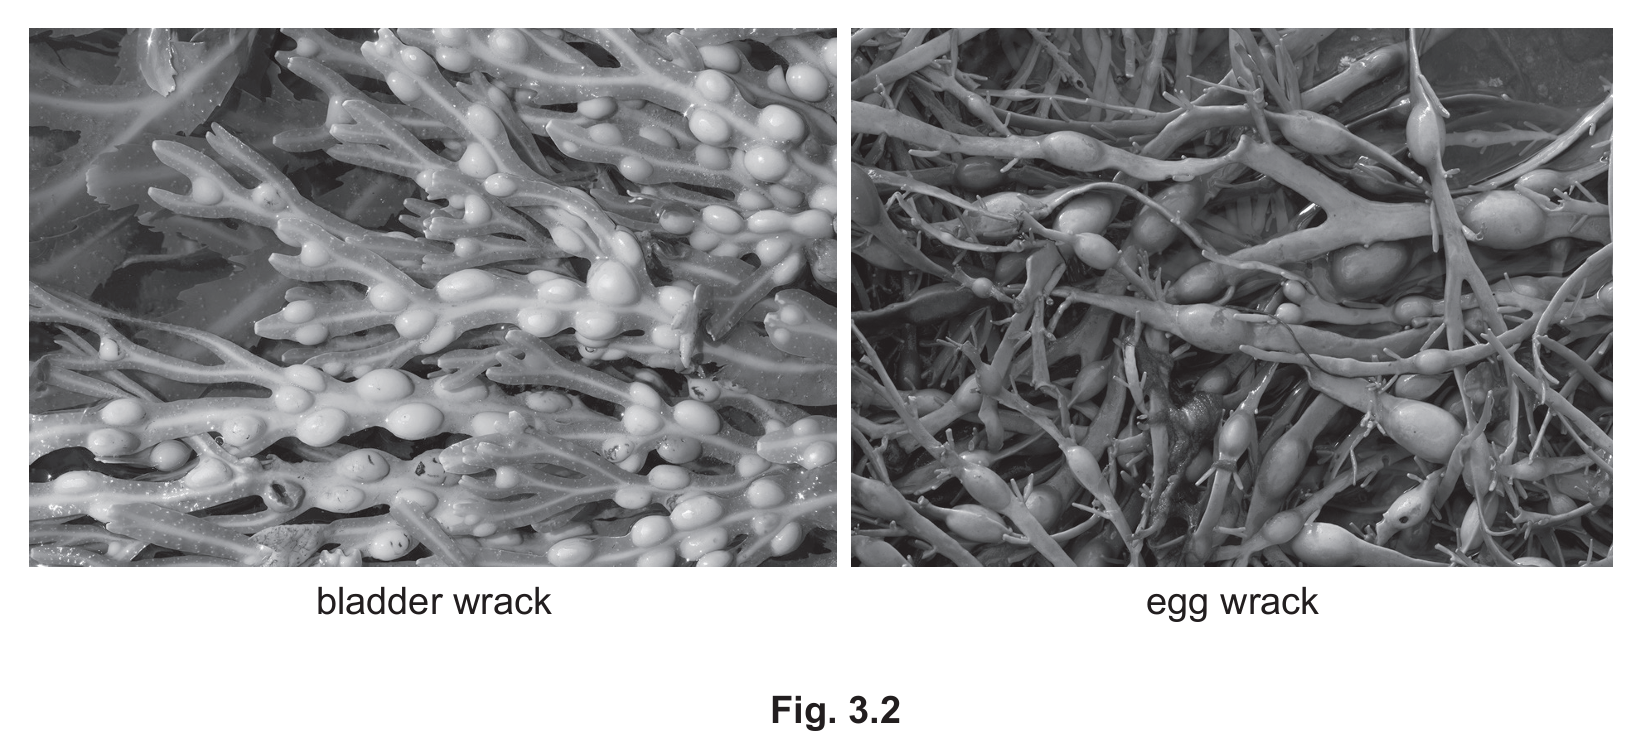
(a) (iii)
Answer: Two differences from:
- Bladder wrack has more bladders
- Bladders are closer together in bladder wrack
- Bladder wrack has bladders in pairs on either side of midrib (egg wrack has single bladders)
- Bladder wrack has a central midrib
- Bladder wrack divides into two at the end (more branched)
Explanation: When comparing the two seaweeds, bladder wrack shows distinct features like paired bladders along a central midrib, while egg wrack has fewer, more spaced-out bladders without the prominent midrib structure.
(b) (i)
Answer: Two variables to keep constant:
- Temperature
- Humidity
- Wind speed
- Species/type of seaweed
- Size/length/surface area of samples
Explanation: To ensure valid results, environmental conditions like temperature and humidity must be constant as they affect water loss. Also, using the same species and similar sized samples eliminates variability due to biological differences.
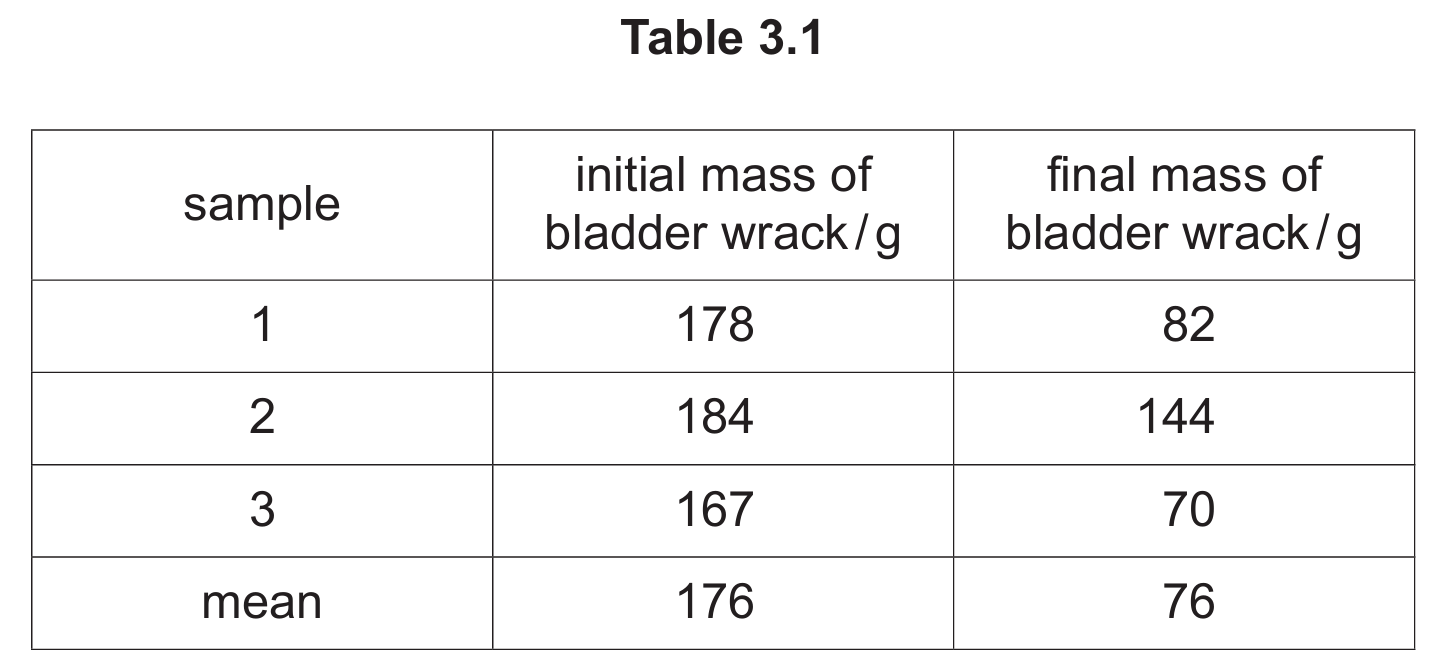
(b) (ii)
Answer: A result that doesn’t fit the pattern/trend.
Explanation: Sample 2’s final mass of 144g is anomalous because it’s much higher than the other two samples (82g and 70g), breaking the consistent pattern of water loss shown by the other samples.
(b) (iii)
Answer: They excluded the anomalous result (sample 2) and calculated the mean of samples 1 and 3 only.
Explanation: The mean was calculated as (82 + 70) ÷ 2 = 76g, intentionally leaving out the 144g value from sample 2 which was clearly inconsistent with the other results.
(b) (iv)
Answer: 57%
Explanation: Calculation steps:
1. Mean initial mass = 176g (given)
2. Mean final mass = 76g (excluding anomalous result)
3. Mass decrease = 176 – 76 = 100g
4. Percentage decrease = (100 ÷ 176) × 100 = 56.81%
Rounded to two significant figures: 57%
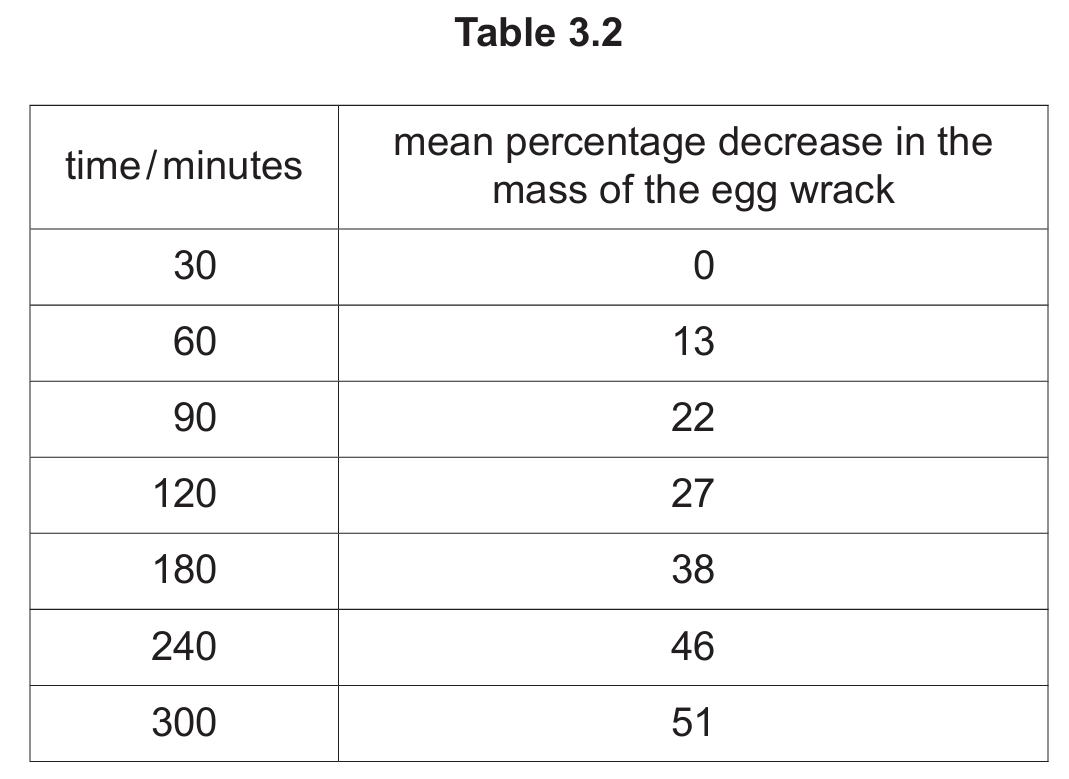
(c)
Answer: The graph should have:
- X-axis labeled “time/minutes” with scale 0-300
- Y-axis labeled “mean percentage decrease in mass” with scale 0-60%
- All seven points accurately plotted (±½ small square)
- A smooth curve connecting the points
Explanation: The graph shows a gradual increase in water loss over time, starting at 0% and reaching 51% after 300 minutes. The curve should show the rate slowing down as time progresses.
(d)
Answer:
Protein: Biuret reagent
Vitamin C: DCPIP
Explanation: Biuret reagent turns purple in the presence of proteins. DCPIP (dichlorophenolindophenol) changes from blue to colorless when reduced by vitamin C, making it a specific test for this vitamin.