▶️ Answer/Explanation
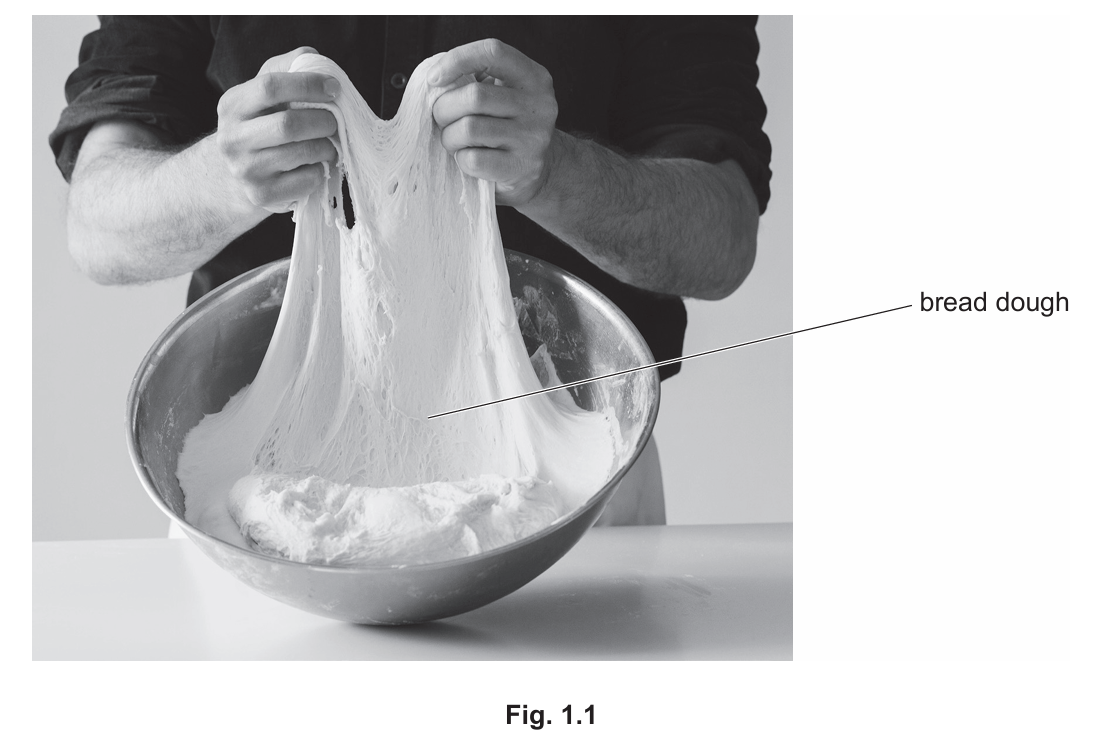
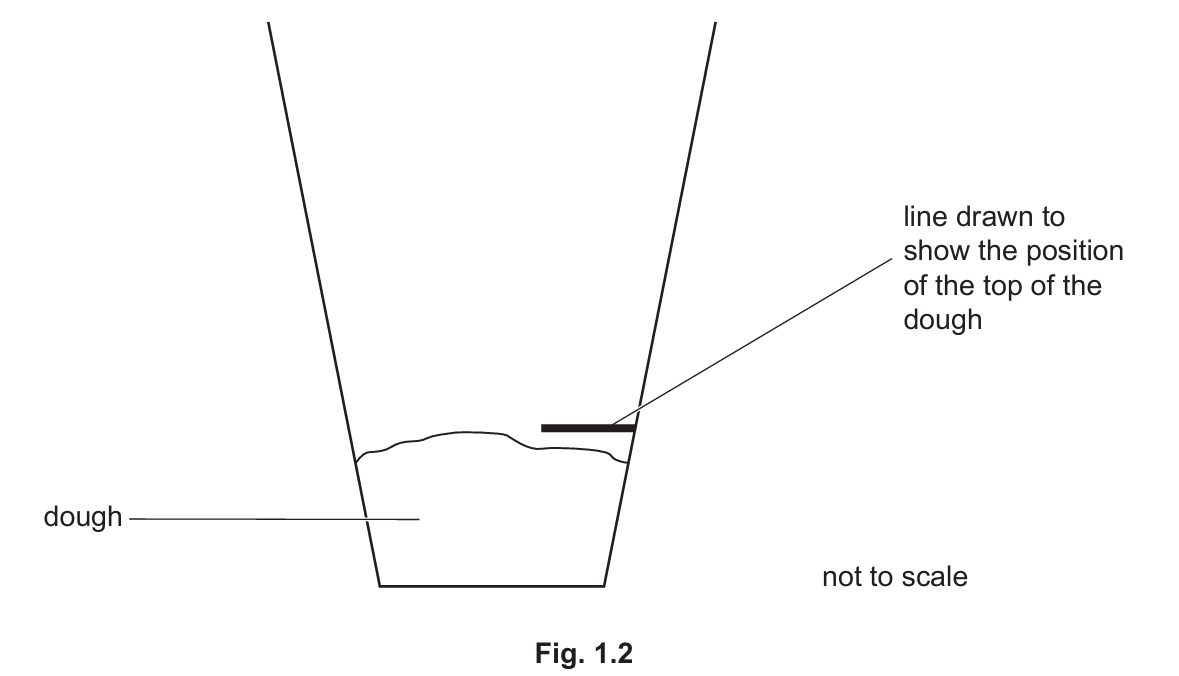
(a)(i) Lines should be drawn on each cup that would intersect the dough line if drawn all the way across.
Explanation: The lines should be drawn at the new height of the dough after 20 minutes, showing how much it has risen due to CO₂ production from yeast respiration.
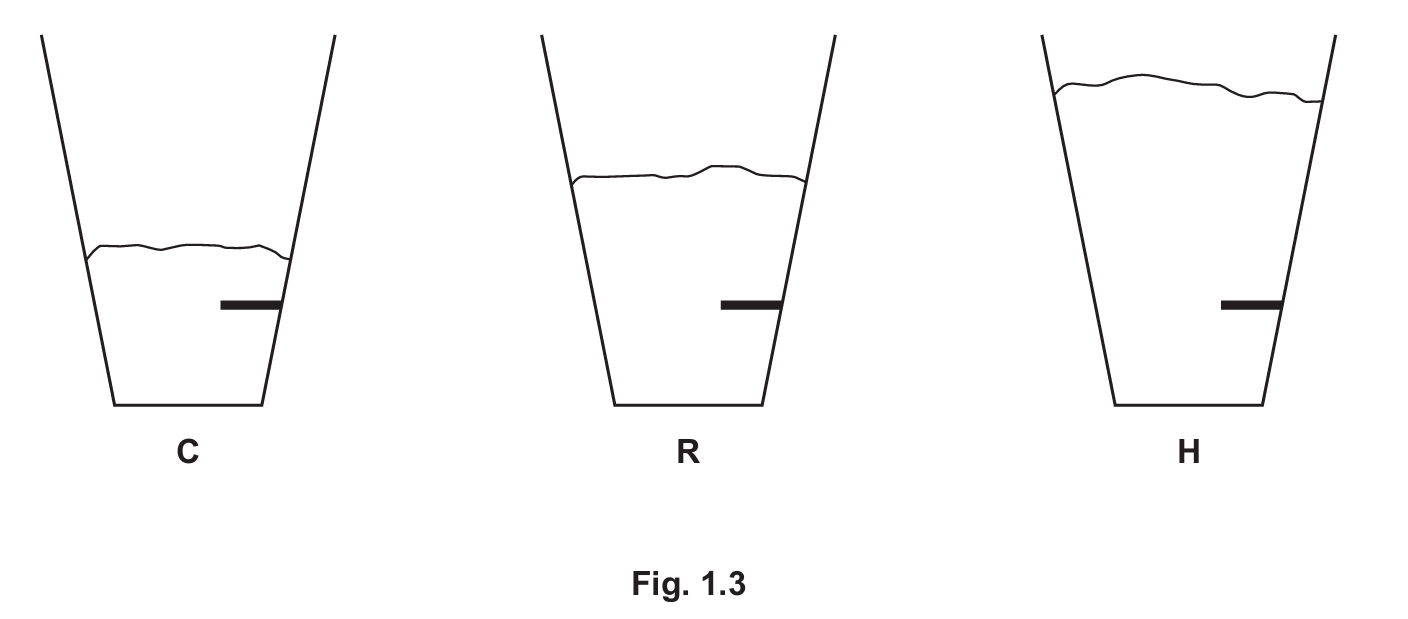
(a)(ii) Example table:
| Cup | Change in dough height (mm) |
|---|---|
| C (5°C) | [measured value] |
| R (20°C) | [measured value] |
| H (40°C) | [measured value] |
Explanation: The table should clearly show the change in dough height for each temperature condition, with appropriate units (mm). The actual values would depend on measurements from Fig. 1.3.
(a)(iii) As temperature increases (the rate of) respiration increases.
Explanation: The conclusion should relate the temperature (independent variable) to the rate of respiration (dependent variable), which is indicated by the dough rising. Higher temperatures generally increase enzyme activity in yeast up to a point, leading to more CO₂ production.
(a)(iv) Temperature.
Explanation: The independent variable is the factor deliberately changed in the experiment, which in this case is the temperature of the water baths (5°C, 20°C, 40°C).
(a)(v) The dough was rounded/not flat/not smooth.
Explanation: An uneven dough surface would make it difficult to accurately measure the height change, as the measurement might vary depending on where you measure from. This introduces variability in the results.
(a)(vi) (Electronic) balance / measuring cylinder.
Explanation: Using a balance would allow precise measurement of the flour and yeast mixture by mass rather than volume, making the amounts more consistent. A measuring cylinder could be used to measure the water more accurately than just pouring 10 cm³.
(a)(vii) To equilibrate the water / so that the water is the same temperature as the water-baths.
Explanation: The five-minute wait ensures the water reaches the exact temperature of each water bath before being added to the dough. Without this step, the water might not be at the intended temperature, affecting the yeast activity.
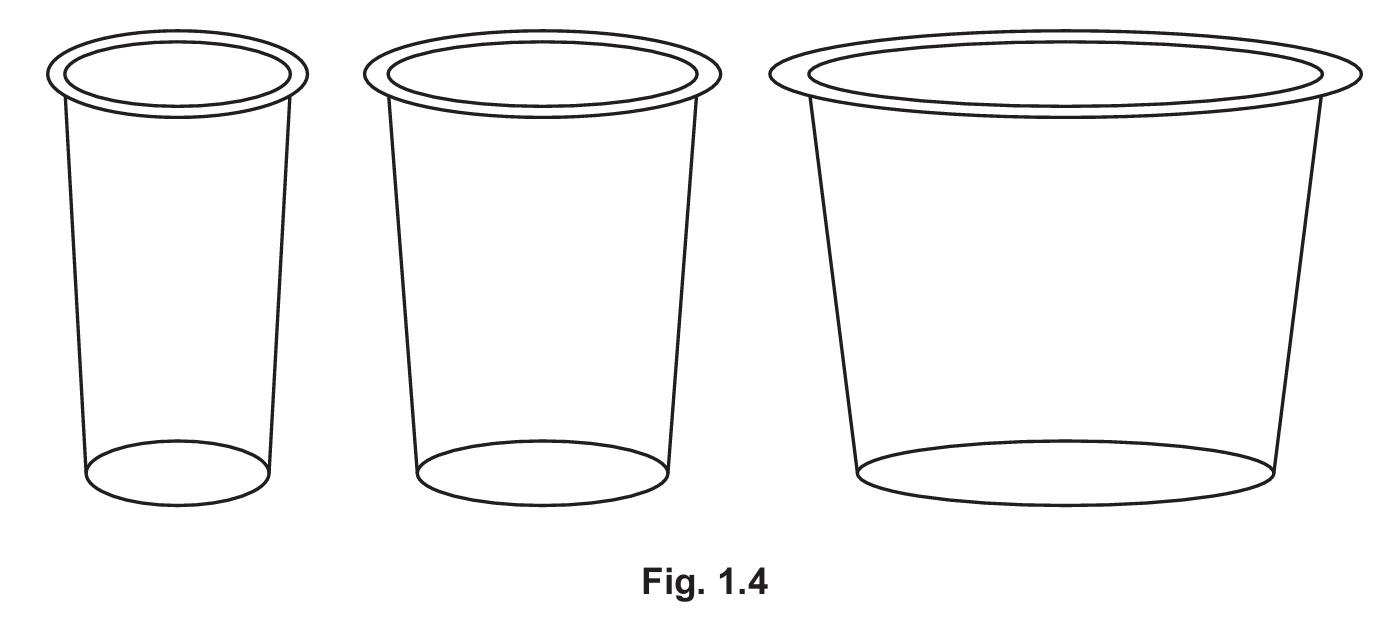
(a)(viii) The initial amount/mass/volume of dough is different in each cup.
Explanation: Different cup diameters mean that the same 1 cm depth represents different volumes of dough mixture in each cup. This introduces another variable (amount of dough) besides temperature, making it impossible to know if results are due to temperature differences or dough quantity differences.
(b)(i) (Brick-)red precipitate.
Explanation: Benedict’s test turns from blue to green/yellow/orange/red (with red being the strongest positive) in the presence of reducing sugars like glucose. A brick-red color indicates a high concentration of reducing sugars.
(b)(ii) Heating (the reagent, risk described) / Benedict’s reagent is toxic/harmful/irritant/corrosive.
Explanation: The Benedict’s test requires heating the mixture in a water bath, which poses burn risks. Also, Benedict’s solution contains copper sulfate which is toxic if ingested and can irritate skin and eyes.
(b)(iii) Limewater.
Explanation: Limewater (calcium hydroxide solution) turns cloudy/milky in the presence of carbon dioxide due to formation of calcium carbonate precipitate.
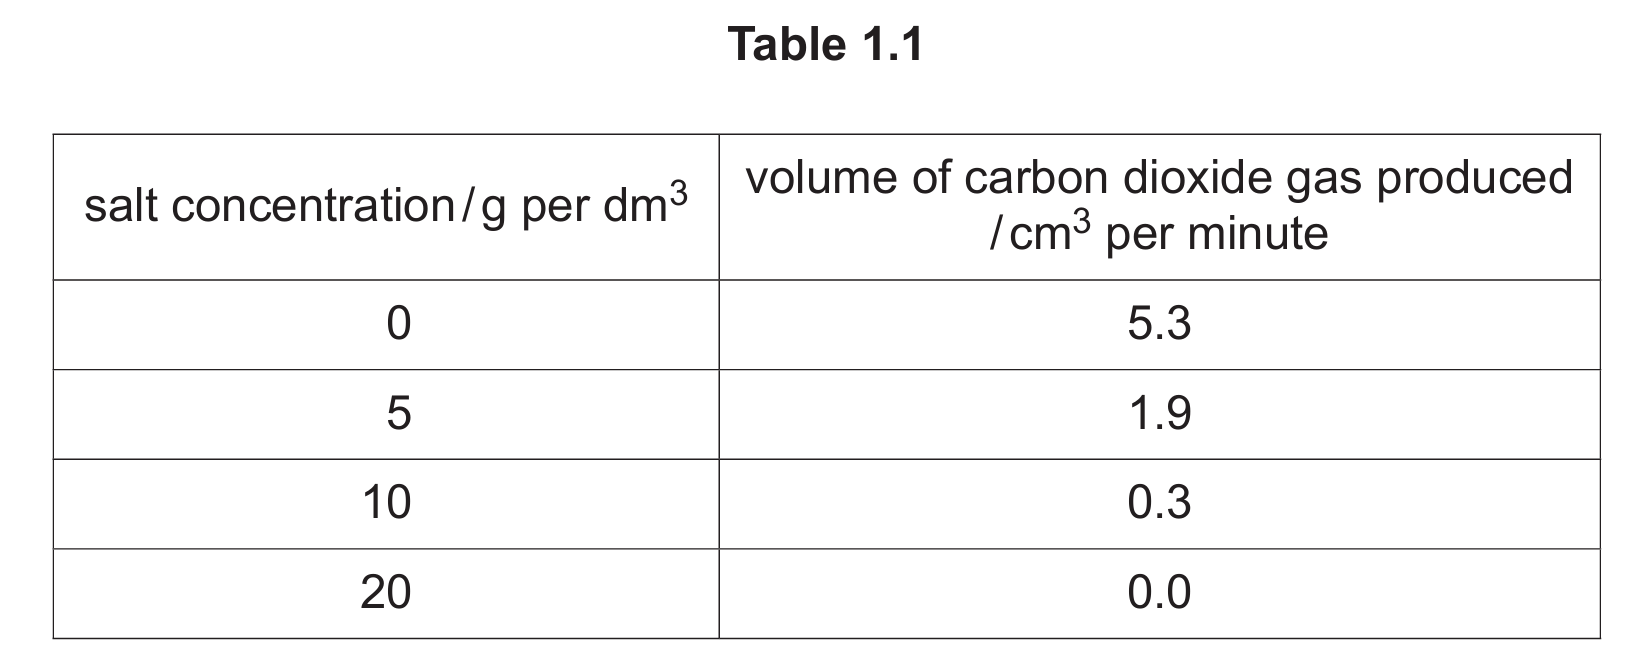
(b)(iv) -94.3%
Calculation:
Initial volume at 0g/dm³ = 5.3 cm³/min
Final volume at 10g/dm³ = 0.3 cm³/min
Change = 0.3 – 5.3 = -5.0 cm³/min
Percentage change = (Change/Initial) × 100 = (-5.0/5.3) × 100 = -94.3396…%
Rounded to one decimal place = -94.3%
Explanation: The negative sign indicates a decrease. There’s a 94.3% reduction in CO₂ production when salt concentration increases from 0 to 10g/dm³, showing salt strongly inhibits yeast respiration.
(c) Investigation plan should include:
- Independent variable: At least two different exercise intensities (e.g., walking vs. running)
- Dependent variable: Breathing rate (count breaths per minute)
- Method of changing intensity: Same exercise type at different speeds or using different equipment (treadmill settings, etc.)
- Measure initial/resting breathing rate before exercise
- Control variables: Same participant, same environmental conditions, same duration of exercise
- Repeats: Multiple trials at each intensity
- Safety: Ensure participant is healthy, proper warm-up, etc.
Explanation: A good plan would specify how to measure breathing rate (e.g., counting chest rises for 30 seconds and doubling), how to standardize exercise intensity (e.g., specific treadmill speeds), and how to ensure reliability (multiple trials). It should control for other factors that affect breathing rate like temperature, time of day, and participant fitness level.

▶️ Answer/Explanation
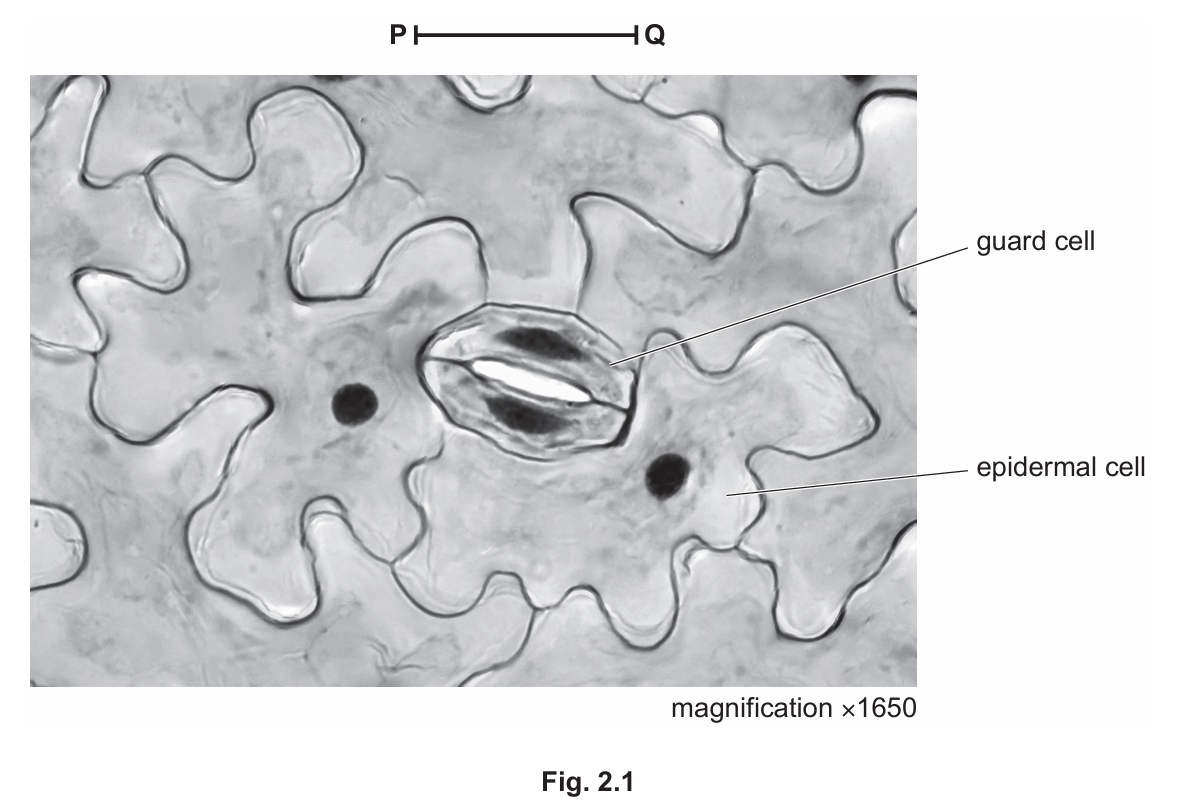
(a)(i)
Answer: Drawing should show:
- Outline as a single clear line with no shading
- Size of the guard cell width at least 31 mm
- At least four nuclei (2 roughly circular for epidermal cells and 2 longer than wide for guard cells)
- Only two epidermal cells touching each other and touching two guard cells
(a)(ii)
Answer:
Length of line PQ: 31 ± 1 mm
Actual length calculation: 0.019 mm
Explanation: Using the magnification formula, if line PQ measures 31 mm at ×1650 magnification, the actual length would be 31 ÷ 1650 = 0.0187878 mm, which rounds to 0.019 mm to two significant figures.
(b)(i)
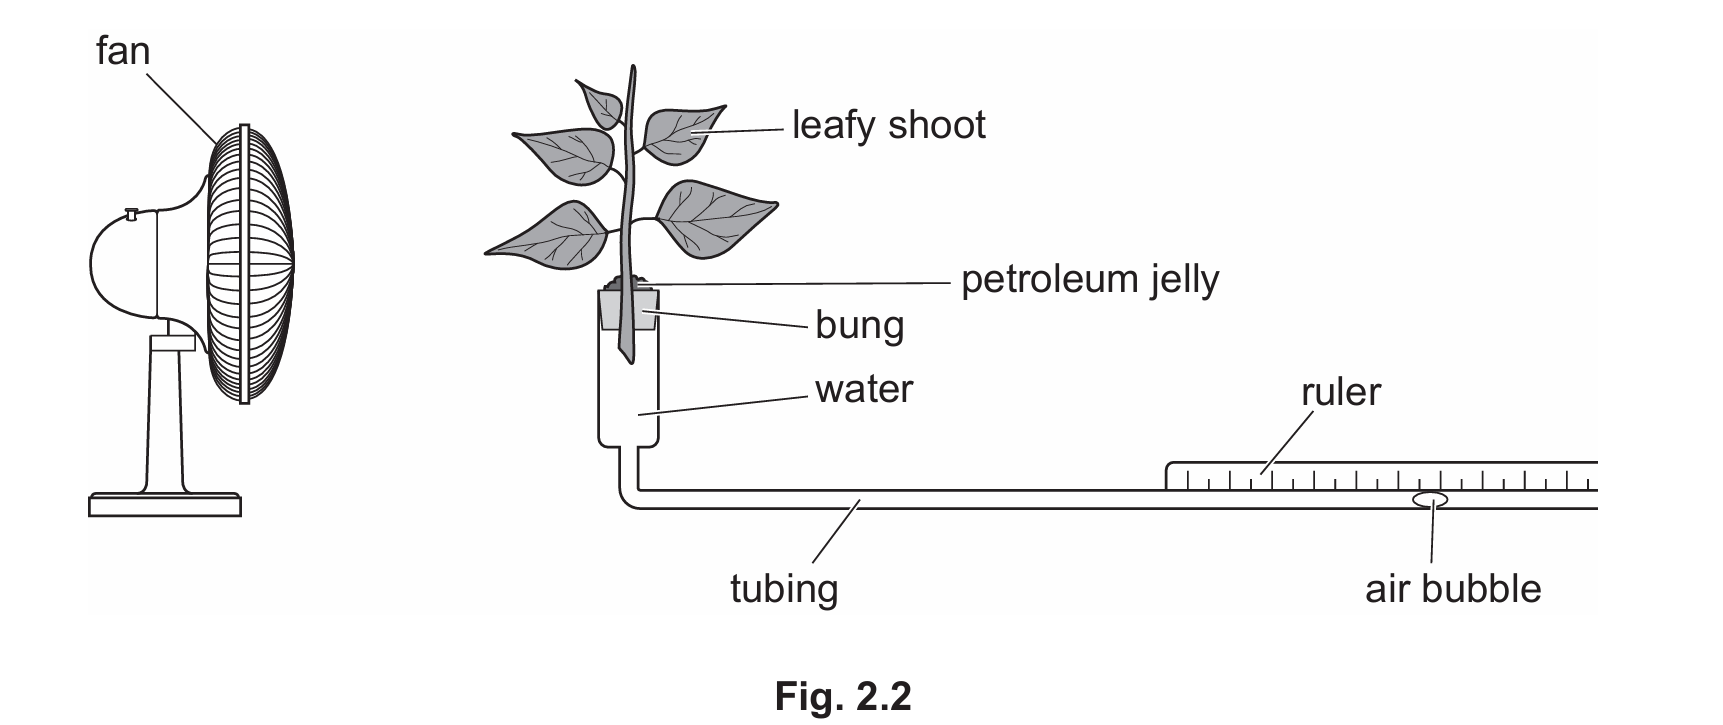
Answer: Distance (air bubble) moved in five minutes / in a set time
Explanation: The dependent variable is what’s being measured in response to changes in wind speed, which is how far the air bubble moves in the potometer tubing over a fixed time period.
(b)(ii)
Answer: Any two from:
- Temperature
- Same potometer
- Number of leaves
- Humidity
- Time measured
Explanation: These factors were kept constant to ensure that only wind speed affects the results, making it a fair test. If these varied, they could influence transpiration rate independently of wind speed.
(b)(iii)
Answer: Airtight seal / prevent water loss
Explanation: The petroleum jelly creates a watertight seal around the bung where the shoot enters the potometer, preventing water from escaping at this point which would give false readings.
(b)(iv)
Answer: To identify anomalous results
Explanation: Repeating the investigation with multiple shoots helps identify any unusual results that might occur due to variations between individual plants or experimental errors. This increases the reliability of the conclusions.
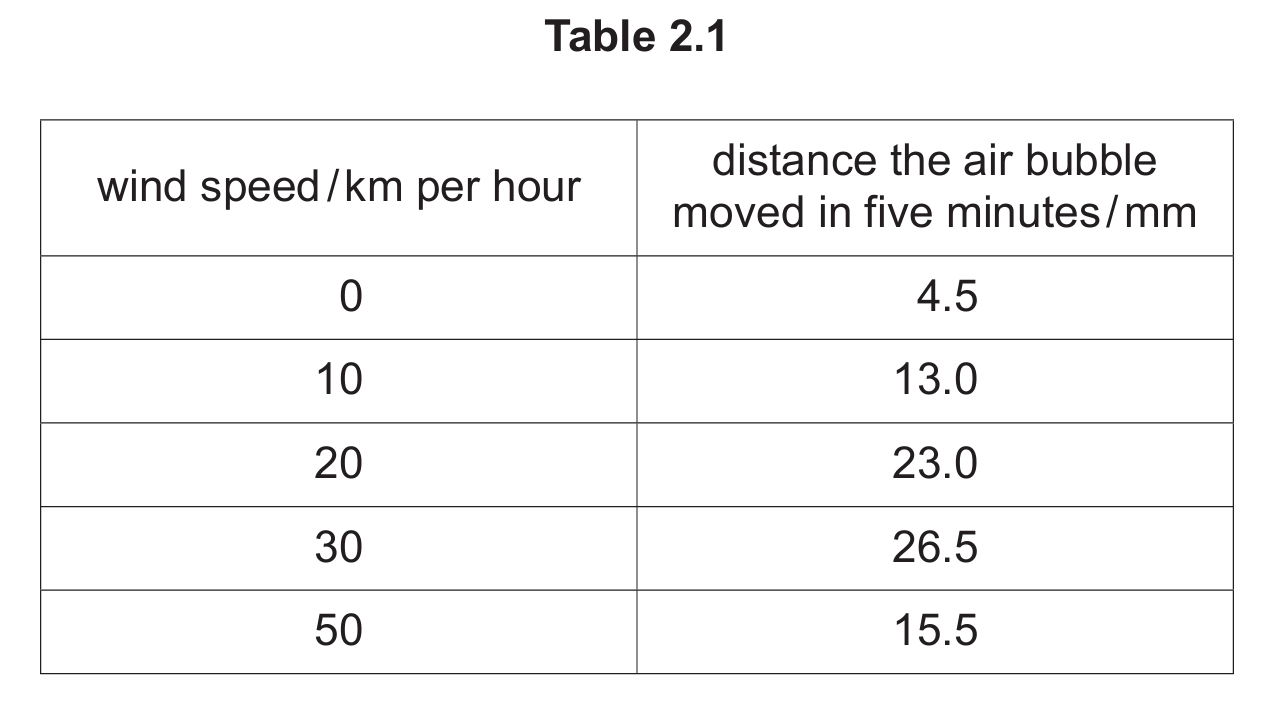
(b)(v)
Answer: Graph should show:
- Axes labelled with units (wind speed in km/hour and distance moved in mm)
- Suitable scale occupying at least half the grid
- All five points plotted accurately
- Smooth curve or line of best fit drawn
(b)(vi)
Answer: Value from graph (approximately 18 mm)
Explanation: From the plotted graph, you would find the point where 15 km/hour intersects the curve and read across to the y-axis to estimate the distance moved. The exact value would depend on how the graph was drawn, but should be between the 10 km/h (13.0 mm) and 20 km/h (23.0 mm) points.