Topic – 9.3
(a) Fig. 1.1 is a photomicrograph showing a cross‑section of an artery
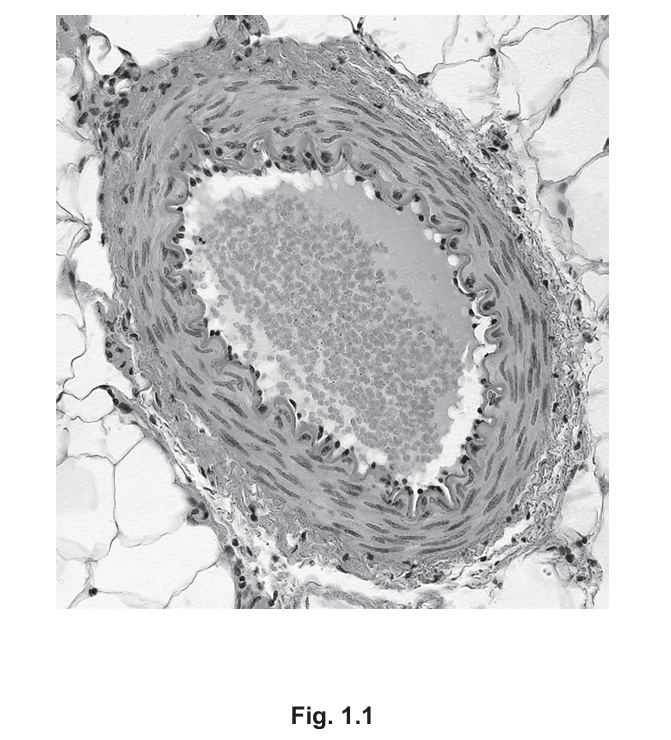
On Fig. 1.1, identify and label the:
- artery wall
- lumen.
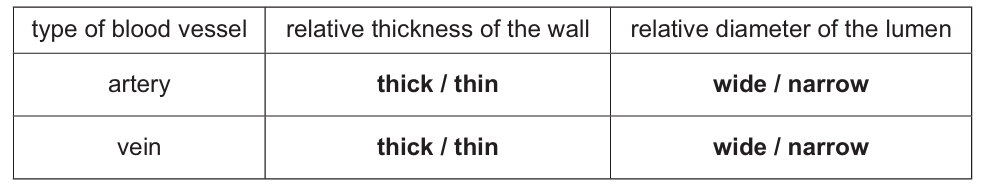
(b) Complete the table by circling the correct words to show the differences between arteries and veins.
(c) State the name of the structures in veins that ensure one‑way flow of blood.
(d) Fig. 1.2 is a simplified diagram of the circulatory system in humans.
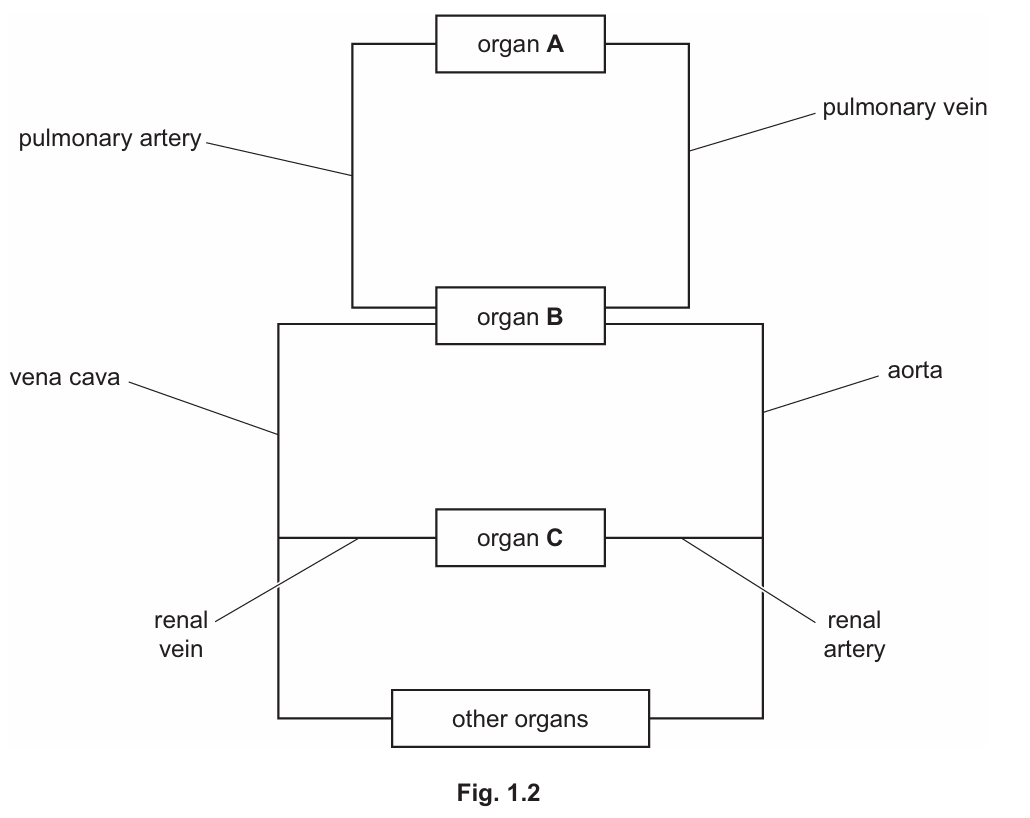
(i) State the names of the organs represented by the letters A, B and C in Fig. 1.2.
(ii) Draw two arrows on Fig. 1.2 to show the direction of blood flow in the pulmonary vein and the pulmonary artery.
(e) State the name of the blood vessels that transfer substances to and from cells.
(f) Circle the names of two waste substances that are transferred from cells to blood.
amino acids carbon dioxide fatty acids glucose oxygen urea
▶️ Answer/Explanation
(a)
The artery wall is the thick muscular layer surrounding the lumen, which is the central space where blood flows. Label these clearly on the diagram.
(b)
Arteries have thick walls and carry oxygenated blood (except pulmonary artery), while veins have thin walls and carry deoxygenated blood (except pulmonary vein). The correct selections are shown in the table.
(c)
Veins contain valves to prevent backflow of blood, ensuring one-way circulation towards the heart.
(d)(i)
A: Lungs (site of oxygenation), B: Heart (pumps blood), C: Kidney (filters waste).
(ii) The pulmonary artery carries deoxygenated blood from the heart (B) to the lungs (A), while the pulmonary vein returns oxygenated blood from the lungs (A) to the heart (B).
(e)
Capillaries facilitate exchange of substances (e.g., oxygen, nutrients) between blood and cells due to their thin walls.
(f)
Waste products removed from cells include carbon dioxide (from respiration) and urea (from protein metabolism). Circle these two.
Final Answers:
(a) artery / wall and lumen labelled ;
(b) 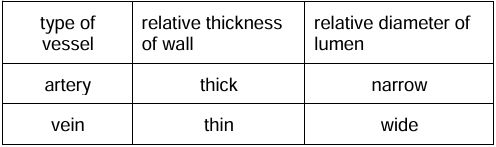
(c) valves ;
(d)(i) A lungs ; B heart ; C kidney ;
(ii) arrows drawn as described ;
(e) capillaries ;
1(f) carbon dioxide and urea circled ;
Topic – 5.1
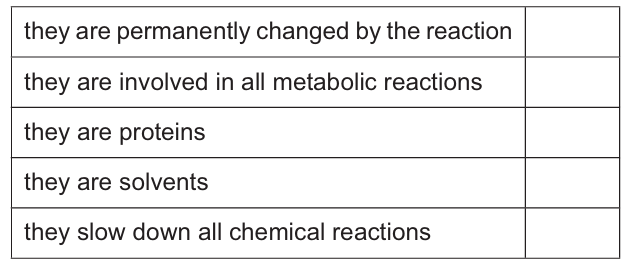
(a) Tick (✓) all the boxes that describe enzymes.
(b) Fig. 2.1 shows the effect of pH on the activity of three different digestive enzymes, X, Y and Z.
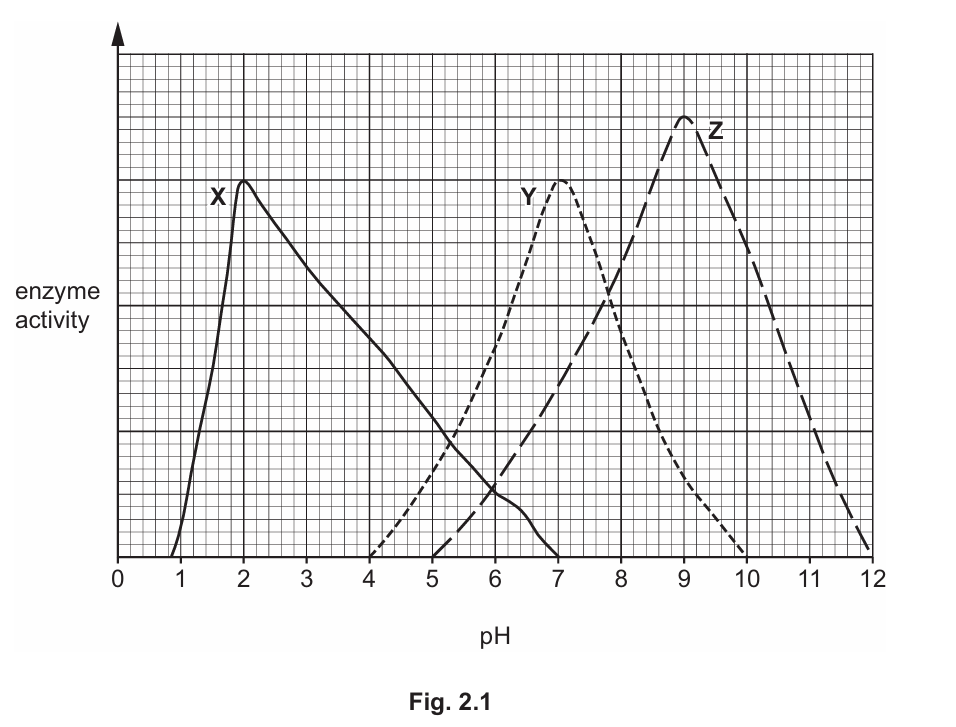
Using the information in Fig. 2.1:
(i) State the optimum pH of enzyme Z.
(ii) State a pH value at which both enzymes X and Y are active.
(iii) State a pH value at which enzyme Y is completely denatured.
(iv) Enzyme X is a protease. Describe its location and action in the digestive system.
(v) Enzyme Y is produced by the salivary glands. State the substrate and product of enzyme Y.
(c) State the type of digestion that uses enzymes.
(d) State one factor, other than pH, that affects enzyme activity.
▶️ Answer/Explanation
2(a)
Box 2: ✓ (Enzymes are involved in all metabolic reactions.)
Box 3: ✓ (Enzymes are proteins.)
Enzymes are biological catalysts that speed up metabolic reactions without being consumed. They are proteinaceous in nature, which is why Box 3 is ticked. Box 2 is correct because enzymes participate in all metabolic pathways.
2(b)
(i) The optimum pH of enzyme Z is 9 (highest activity at pH 9).
(ii) A pH where both X and Y are active is 5 (both show activity at this pH).
(iii) Enzyme Y is denatured at pH 2 (no activity at strongly acidic pH).
(iv) Location: Stomach. Action: Breaks down proteins into amino acids.
(v) Substrate: Starch. Product: Maltose/simple sugars.
From the graph, enzyme Z peaks at pH 9. Both X and Y are active around pH 5. Protease (X) acts in the stomach, while salivary amylase (Y) digests starch.
2(c)
Chemical digestion (enzymes catalyze the breakdown of food molecules).
Enzymes facilitate chemical digestion by hydrolyzing complex molecules into simpler absorbable forms.
2(d)
Temperature (enzyme activity is highly temperature-sensitive).
Enzymes have an optimal temperature range; deviations (too high/low) reduce activity or cause denaturation.
Topic – 19.3
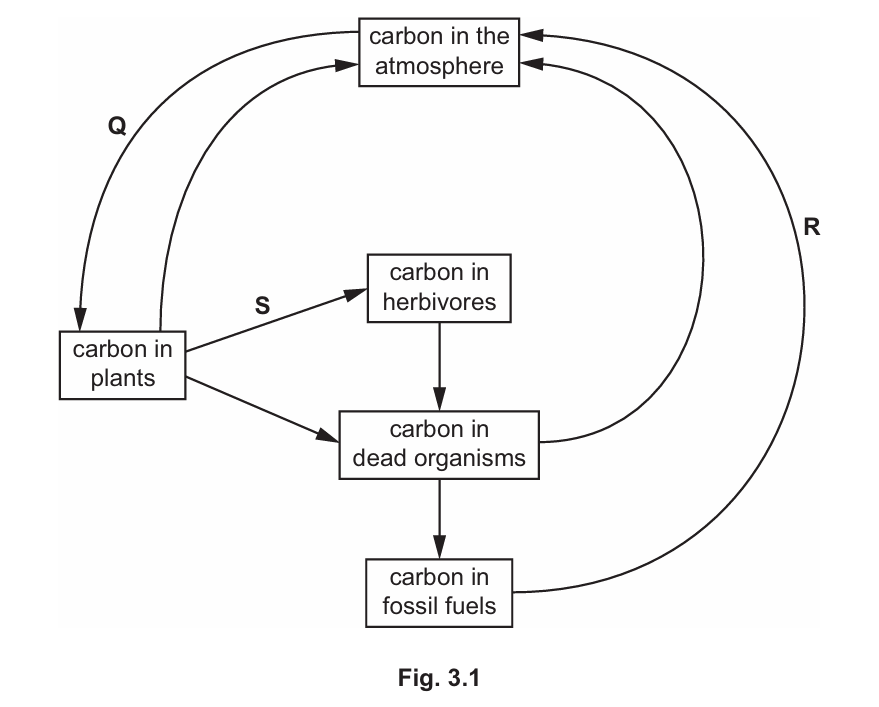
(a) Fig. 3.1 is a diagram of part of the carbon cycle.
Three processes that occur in the carbon cycle are labelled Q, R and S.
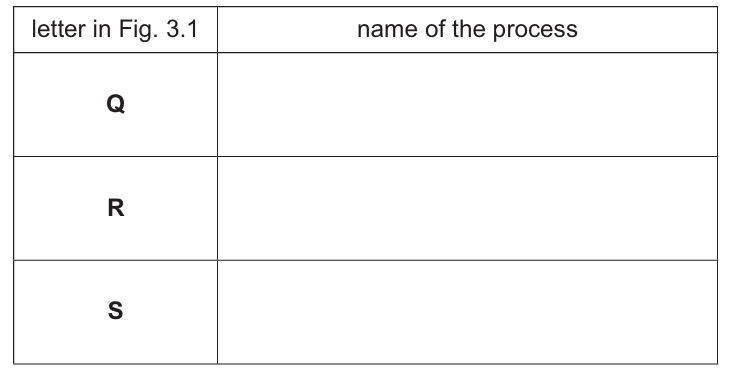
(i) Complete the table by stating the names of processes Q, R and S in Fig. 3.1.
(ii) Draw one arrow on Fig. 3.1 to represent the transfer of carbon by respiration in herbivores.
(b) Carbon dioxide is one gas that causes climate change.
State the name of one other gas that causes climate change.
(c) Suggest one way that humans can increase the rate of removal of carbon dioxide from the atmosphere.
(d) Proteins contain carbon.
State two other chemical elements all proteins contain.
(e) Describe what is meant by the term carnivore.
▶️ Answer/Explanation
(a)(i)
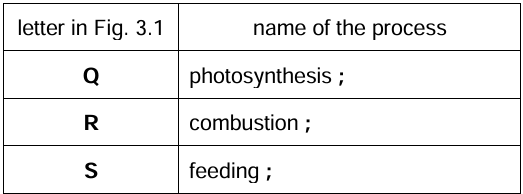
Explanation: Process Q is photosynthesis, where plants convert CO2 into organic compounds. Process R is feeding, where carbon is transferred from plants to herbivores. Process S is respiration, releasing CO2 back into the atmosphere.
(a)(ii)
Arrow drawn from ‘carbon in herbivores’ to ‘carbon in the atmosphere’.
Explanation: Herbivores respire, releasing CO2 into the atmosphere, completing the carbon cycle.
(b) Methane (CH4)
Explanation: Methane is a potent greenhouse gas released from livestock, landfills, and fossil fuel extraction.
(c) Plant more trees.
Explanation: Trees absorb CO2 during photosynthesis, increasing carbon sequestration.
(d) Nitrogen (N) and Hydrogen (H)
Explanation: Proteins are composed of carbon (C), hydrogen (H), oxygen (O), and nitrogen (N), with some containing sulfur (S).
(e) A carnivore is an animal that obtains energy by consuming other animals.
Explanation: Carnivores are secondary or tertiary consumers in food chains, feeding exclusively on other animals.
Topic – 19.4
A population of a species of fish was accidentally introduced into a lake.
(a) State two features that can be used to classify this introduced species as a fish.
(b) Describe what is meant by the term population.
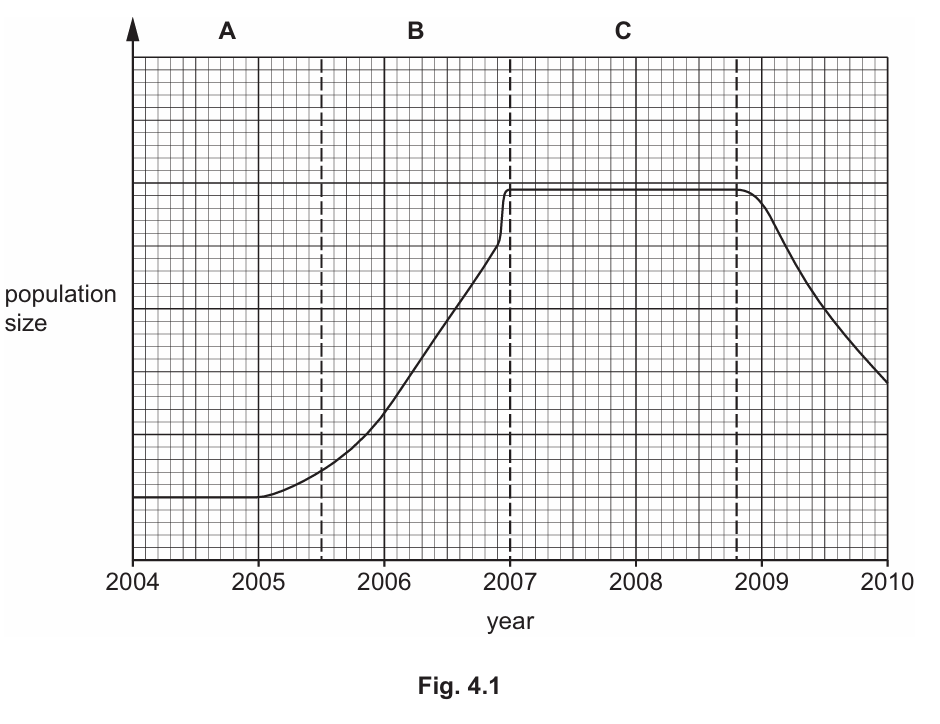
(c) Fig. 4.1 shows the changes in the population size of the introduced fish species in the lake between 2004 and 2010.
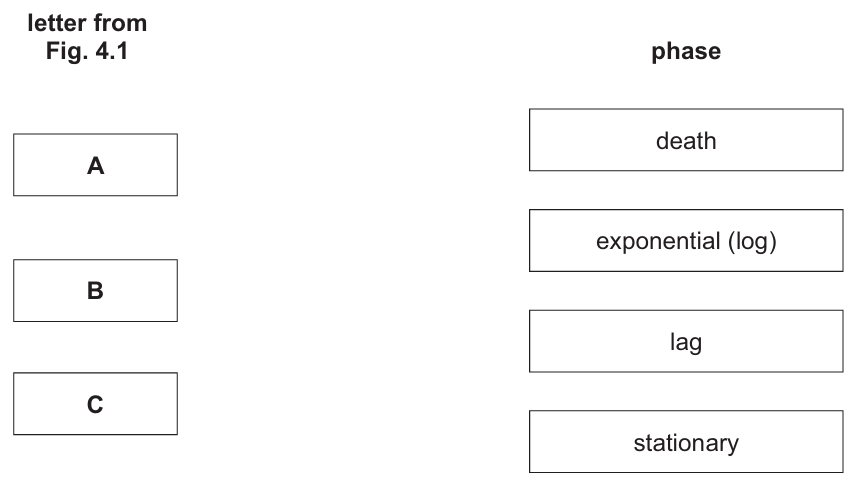
(i) The boxes on the left show the letters identifying the sections of the graph in Fig. 4.1.
The boxes on the right show the phases of population growth.
Draw lines to link each letter with the correct phase.
Draw three lines.
(ii) Describe possible reasons for the change in population size between 2009 and 2010 in Fig. 4.1.
▶️ Answer/Explanation
(a) Any two from:
• Scales
• Gills
• Swim bladder
• Fins
• Lateral line
(These are defining features of fish, distinguishing them from other aquatic organisms.)
(b) A population refers to a group of organisms of the same species living in the same area at the same time. (This definition highlights the ecological context of the term.)
(c)(i)
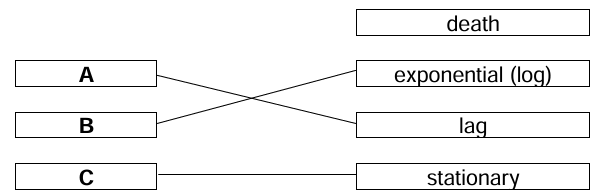
(The graph sections are matched with phases: exponential growth, stationary phase, and decline.)
(c)(ii) Possible reasons for the population decline between 2009 and 2010 include:
• Increased predation or overfishing
• Disease or pollution
• Competition for limited resources
(These factors explain the observed decrease in population size during the specified period.)
Topic – 8.3
(a) A student investigated the effect of windspeed on the rate of transpiration.
The student placed a fan at different distances from a plant shoot and measured the distance the air bubble moved in three minutes.
The distance the air bubble moved can be used to calculate the rate of water uptake, which is equivalent to the rate of transpiration.
Fig. 5.1 shows the apparatus the student used.
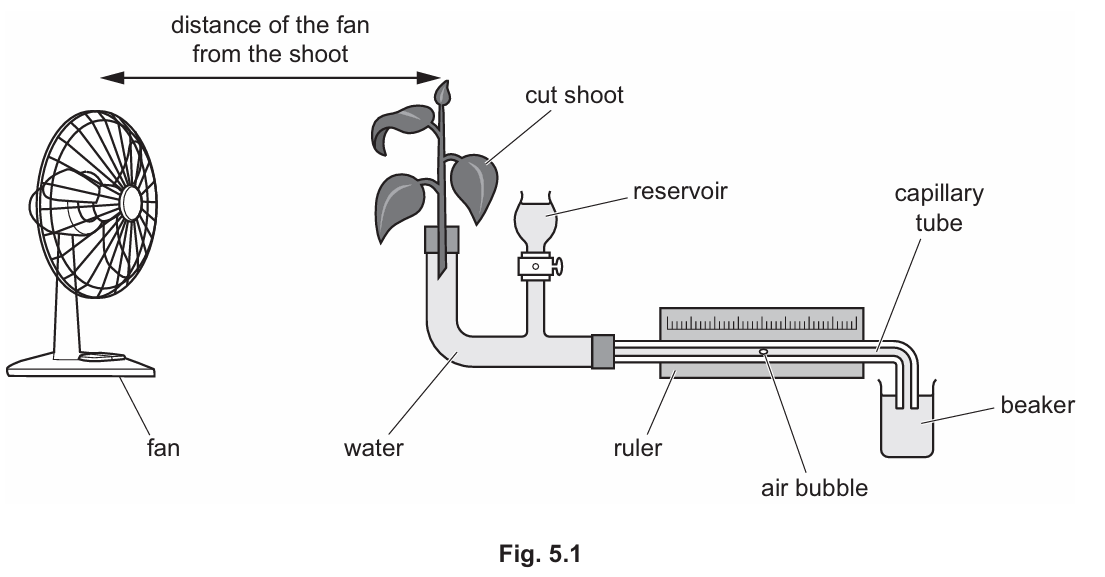
Table 5.1 shows their results.
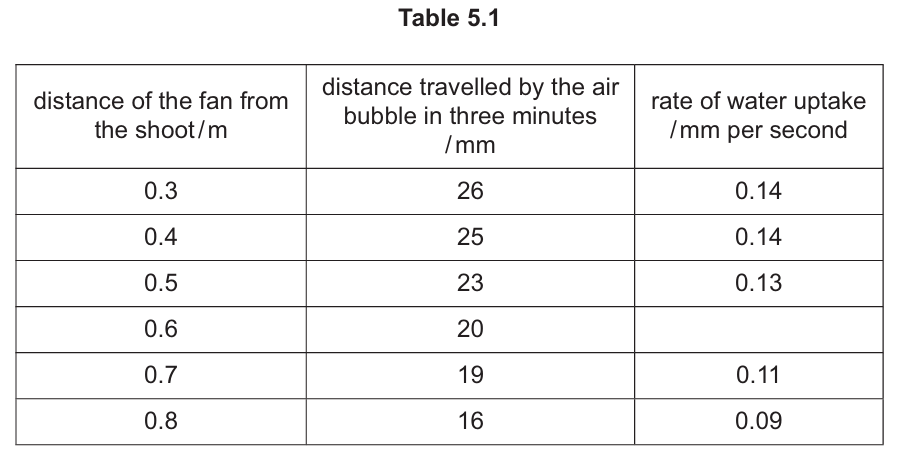
(i) Calculate the rate of water uptake when the fan is 0.6 m from the plant shoot.
Give your answer to two decimal places.
Space for working.
(ii) Using the information in Fig. 5.1 and Table 5.1, complete the sentences by writing a word or phrase in the spaces to describe the results.
As the fan is moved further away from the shoot, the windspeed …………………………………… and the …………………………………… moved by the air bubble decreased.
During transpiration water evaporates from the surfaces of the …………………………………… cells into the air spaces inside the leaf. The water vapour diffuses out of the leaf through the …………………………………… . This causes water to move through the capillary tube causing the air bubble to move towards …………………………………… .
(iii) State one other factor that affects the rate of transpiration.
(b) State two uses of water in a plant.
(c) Explain why the leaf can be described as an organ.
▶️ Answer/Explanation
(a)(i) Ans: 0.11 mm per second
From Table 5.1, at 0.6 m, the distance moved is 20 mm in 3 minutes (180 seconds). The rate is calculated as \( \frac{20}{180} \approx 0.11 \, \text{mm per second} \).
(a)(ii) Ans: decreased ; distance ; mesophyll ; stomata ; shoot/plant/left/leaf
As the fan moves further, windspeed decreases, reducing the air bubble’s movement. Water evaporates from mesophyll cells, diffuses through stomata, and pulls water towards the shoot.
(a)(iii) Ans: temperature/humidity/light intensity
Higher temperature increases transpiration by speeding up evaporation, while humidity and light also influence the rate.
(b) Ans: Any two from: photosynthesis, solvent, transport, support, germination.
Water is essential for photosynthesis, acts as a solvent for nutrients, and provides structural support via turgor pressure.
(c) Ans: A leaf is a group of tissues performing specific functions.
Leaves contain multiple tissues (e.g., xylem, phloem, mesophyll) working together for photosynthesis and gas exchange, qualifying them as organs.
Topic – 18.3
Fig. 6.1 is a photograph of intensive egg production on a chicken farm.

(a) In 1905, each chicken produced a mean of 120 eggs per year. In 2021, each chicken produced a mean of 300 eggs per year.
Calculate the percentage increase in mean egg production per year.
(b) Egg production has increased due to selective breeding and intensive farming.
Describe the disadvantages of intensive livestock farming.
(c) Complete the flowchart to describe how egg production in chickens is increased by selective breeding.

(d) Selective breeding is also used to increase crop plant production.
State two other ways to increase crop plant production.
▶️ Answer/Explanation
(a) 150%
The percentage increase is calculated as:
\[ \frac{300 – 120}{120} \times 100 = 150\% \]
The increase from 120 to 300 eggs is 180, which is 150% of the original production.
(b) Three disadvantages of intensive livestock farming include:
1. Pollution and greenhouse gas emissions.
2. Animal welfare concerns due to overcrowding.
3. Increased antibiotic use leading to resistance.
(c) The flowchart steps for selective breeding:
1. Select chickens that lay the most eggs.
2. Breed them to produce offspring.
3. Repeat over generations for higher productivity.
(d) Two other ways to increase crop production:
1. Use of fertilisers to enhance soil nutrients.
2. Genetic modification for higher-yielding crops.
Topic – 21.1
(a) A scientist investigated the effect of the enzyme pectinase on the volume of fruit juice produced by the same mass of two different fruits.
Fig. 7.1 shows the results.
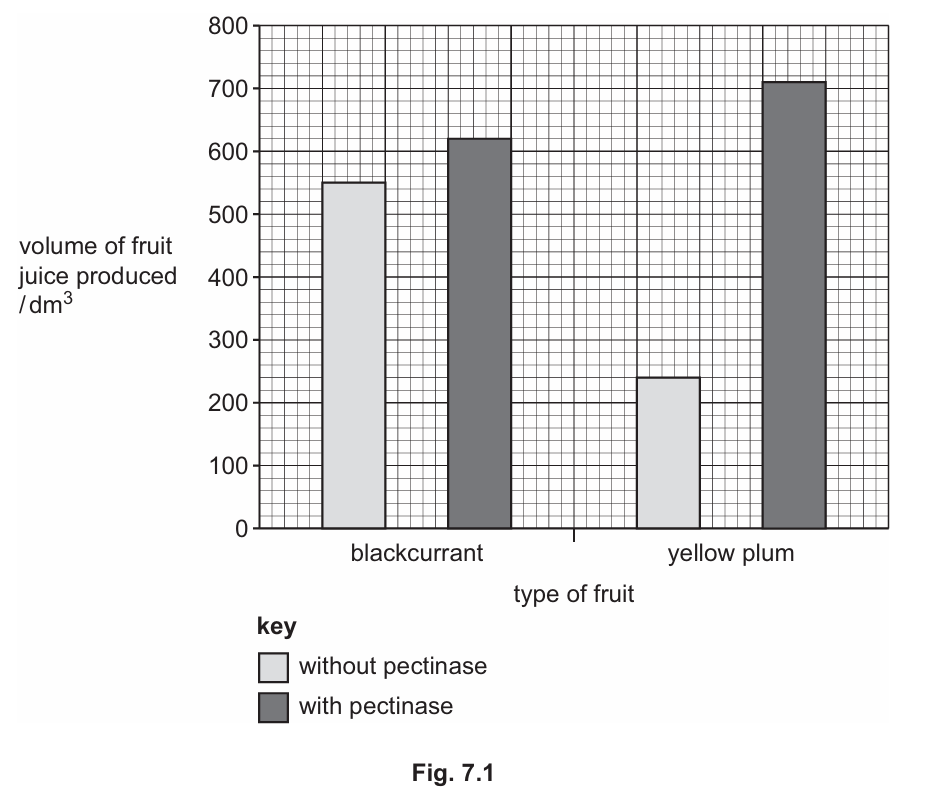
Describe the results shown in Fig. 7.1.
(b) State two components of a balanced diet that are provided by fruits such as blackcurrants and plums.
(c) State two reasons why bacteria are useful in biotechnology and genetic modification.
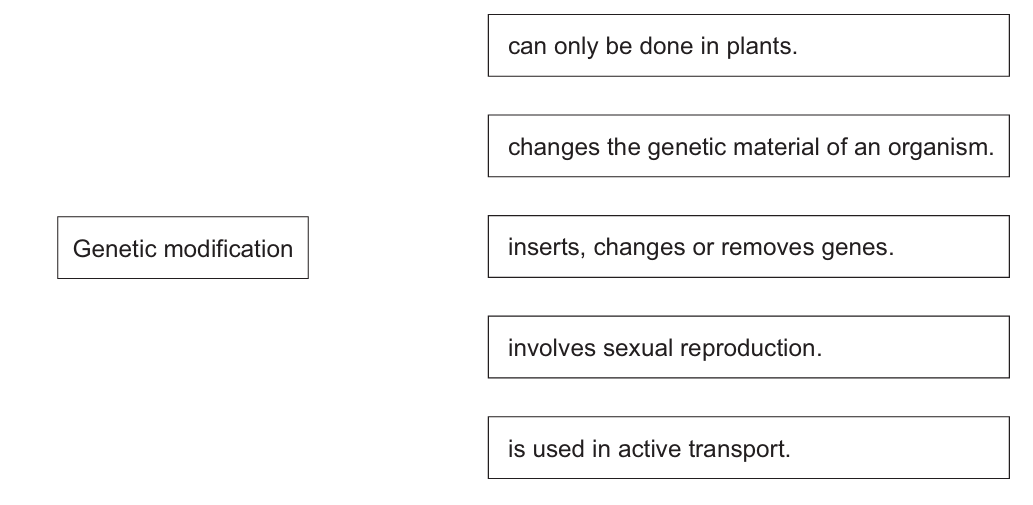
(d) The box on the left contains the beginning of a sentence.
The boxes on the right show some sentence endings.
Draw two lines to make two correct sentences.
▶️ Answer/Explanation
(a) Answer:
The results show that pectinase increases juice yield in both fruits. Plums produce more juice than blackcurrants with pectinase, while without pectinase, blackcurrants yield more juice. The enzyme has a greater effect on plums, indicating variability in pectin content.
(b) Answer:
1. Vitamins (e.g., Vitamin C in blackcurrants)
2. Dietary fiber (aids digestion and maintains gut health).
(c) Answer:
1. Rapid reproduction allows quick production of desired molecules.
2. Simple genetic manipulation enables easy insertion of foreign genes.
(d) Answer:
1. Genetic modification changes the genetic material of an organism.
2. Genetic modification inserts, changes, or removes genes.
Topic – 11.1
(a) Alveoli are the gas exchange surfaces in humans.
(i) State two features of gas exchange surfaces in humans.
(ii) State the name of the organ system alveoli belong to.
(b) State the word equation for aerobic respiration.
(c) Explain why muscle cells have a high rate of respiration.
▶️ Answer/Explanation
(a)(i) Any two from: large surface area; thin surface; good blood supply; good ventilation; moist. These features maximize diffusion rate for efficient gas exchange.
(a)(ii) Respiratory system. Alveoli are the functional units where gas exchange occurs in this system.
(b) The word equation for aerobic respiration is: glucose + oxygen → carbon dioxide + water. This represents the complete oxidation of glucose to release energy.
(c) Muscle cells respire at a high rate because they require constant energy (ATP) for contraction and movement. More respiration provides the necessary energy for muscle function.