▶️ Answer/Explanation
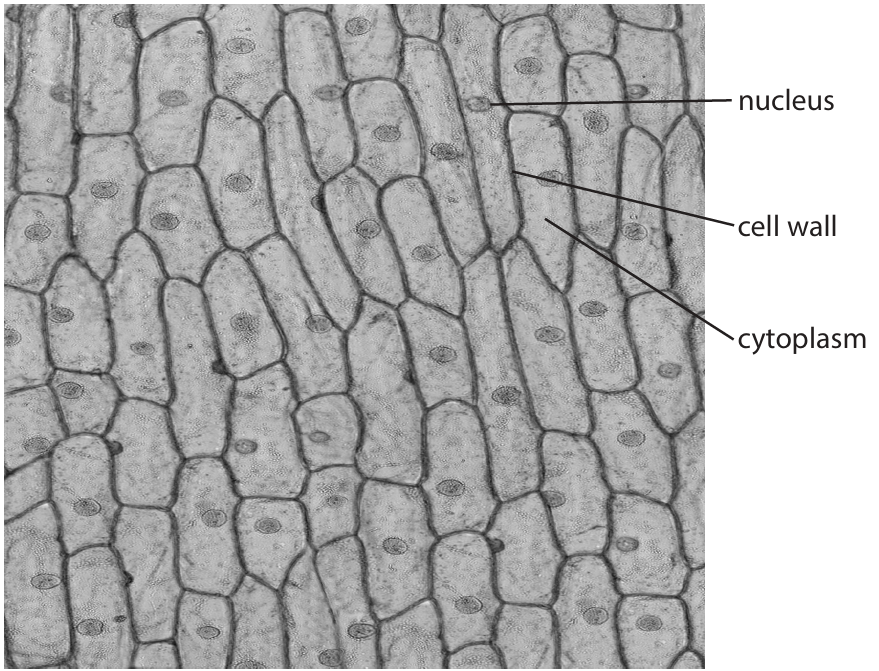
(a)(i) C (absent, present, absent)
A is incorrect because red blood cells have cytoplasm.
B is incorrect because human red blood cells do not have a nucleus.
D is incorrect because red blood cells do not have a cell wall.
(a)(ii) D (tissue)
A is incorrect because organs have more than one cell type.
B is incorrect because organisms have more than one cell type.
C is incorrect because systems have more than one cell type.
(b)(i) A description that makes reference to the following:
• use a syringe / pipette / beaker / (measuring) cylinder / eq (1)
• mix 5 cm\(^3\) of (10%) sucrose solution with 5 cm\(^3\) water / eq (1)
Accept other correct measuring apparatus.
Accept take 5 cm\(^3\) sucrose and make up to 10 cm\(^3\) with water / add equal volumes of water and sucrose and use 10 cm\(^3\) / eq.
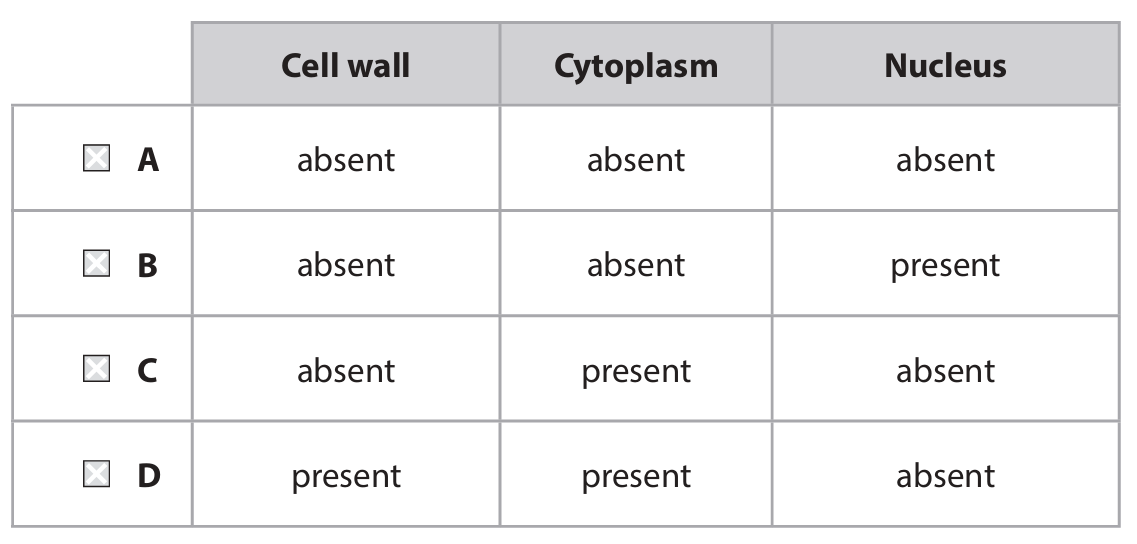
(b)(ii) An explanation that makes reference to three of the following:
• water leaves (the cells) / eq (1)
• by osmosis (1)
• from a high(er) water potential to a lower water potential / from higher water concentration to lower water concentration / from dilute solution to concentrated solution / eq (1)
• membrane detaches from cell wall / cell is flaccid / cytoplasm shrinks / cytoplasm volume decreases / cells are plasmolysed / eq (1)
Accept lose water.
Accept water moves from a high concentration to a low concentration.
Ignore cell shrinks.
▶️ Answer/Explanation
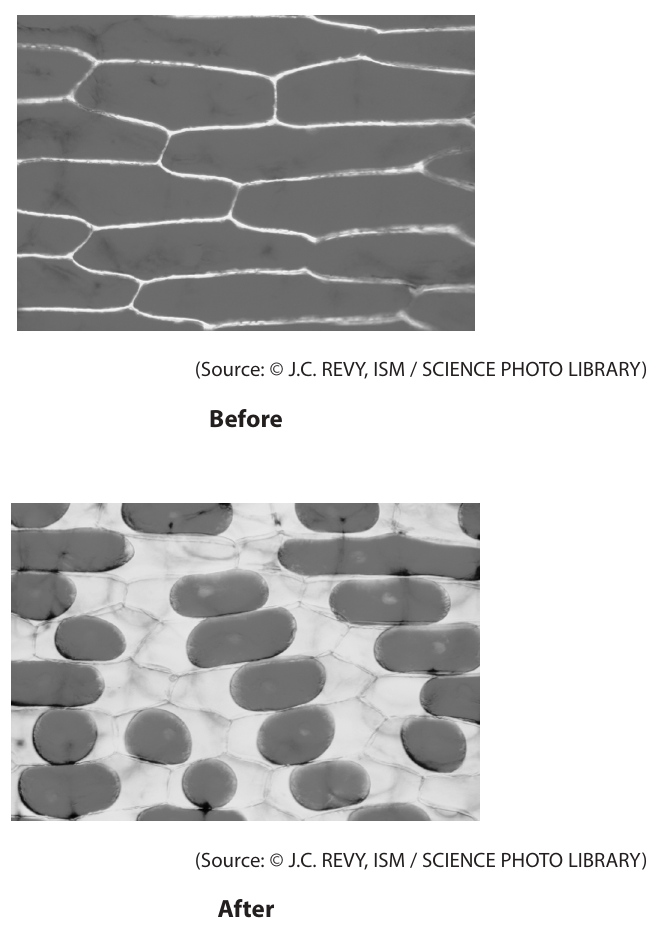
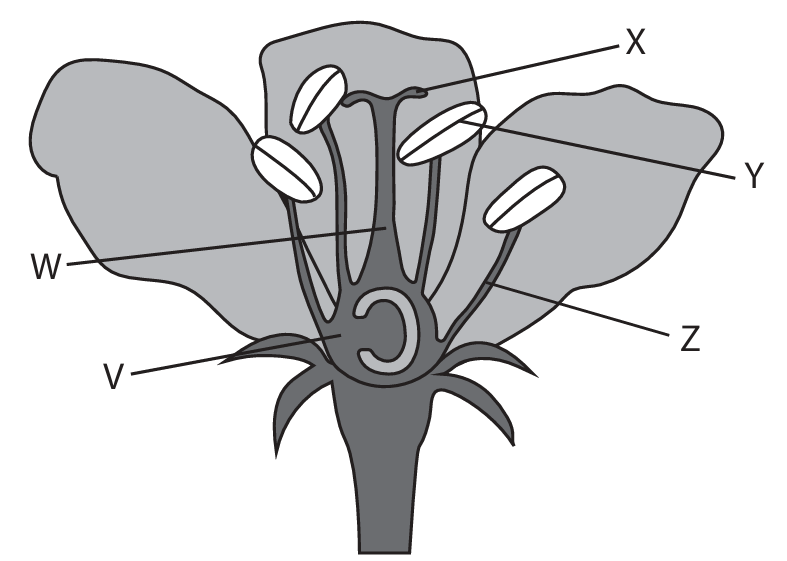
(a)(i) C (Y)
A is incorrect because V is the ovary.
B is incorrect because X is the stigma.
D is incorrect because Z is the filament.
(a)(ii) A (V)
B is incorrect because W does not become a fruit.
C is incorrect because X does not become a fruit.
D is incorrect because Y does not become a fruit.
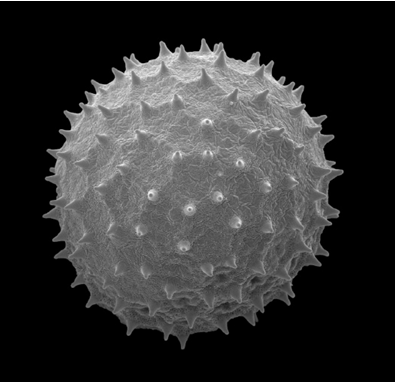
(b)(i) 96 (\( \times \))
Stages of calculation:
• Convert mm to \( \mu m \): 30 mm = \( 30 \times 1000 = 30000 \) \( \mu m \).
• Magnification = \( \frac{\text{image size}}{\text{actual size}} = \frac{30000}{313} \).
• Calculation: \( \frac{30000}{313} \approx 95.85 \).
• To nearest whole number = 96.
(b)(ii) • spikes / hooks / sticky / eq (1)
(c) An answer that makes reference to two of the following:
• asexual reproduction (1)
• cuttings are genetically identical / have same alleles / same genes / are clones / eq (1)
• faster / can be produced at any time of year / can be done from only one plant / no need to have insects / eq (1)

▶️ Answer/Explanation
(a)(i) diaphragm
(a)(ii) C (increases, decreases)
A is incorrect because the volume increases.
B is incorrect because the volume increases.
D is incorrect because the pressure decreases.
(a)(iii) Two from:
• jar cannot expand / is rigid (ribcage can move)
• no intercostal muscles / no ribs
• no pleural membrane / no pleural fluid / balloons do not touch sides of jar
(b)(i) D (trachea → bronchus → bronchiole → alveolus)
A is incorrect because bronchiole is not first.
B is incorrect because bronchus is not first.
C is incorrect because bronchiole is not second.
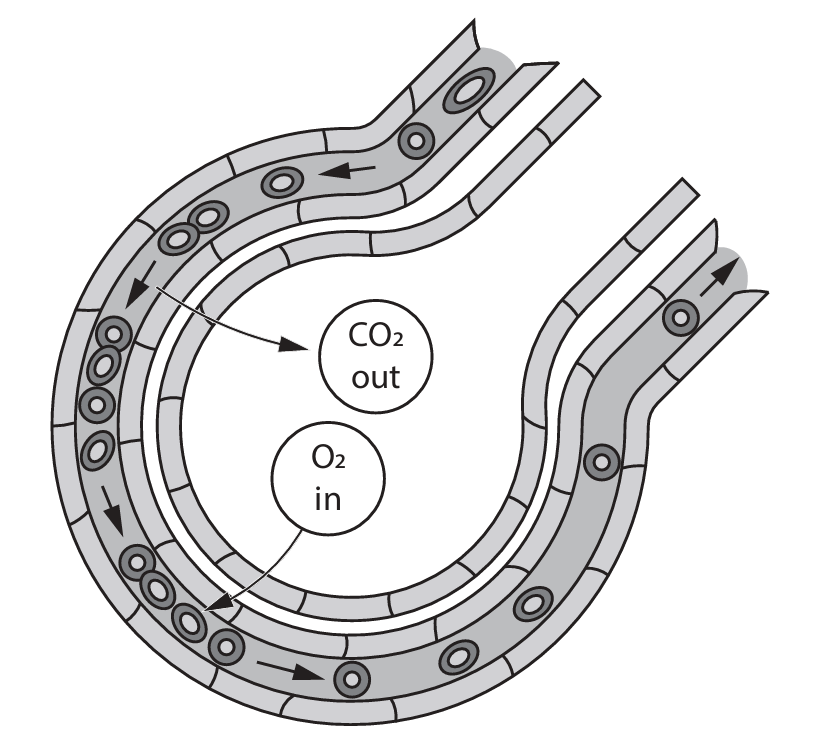
(b)(ii) \( 4.8 \times 10^8 \times 4.0 \times 10^{-3} = 1.92 \times 10^6 \) mm2 (or \( 1.9 \times 10^6 \) mm2)
(b)(iii) Two adaptations, each with explanation:
1. One cell thick / thin walls → short diffusion pathway / rapid diffusion.
2. Surrounded by capillaries / good blood supply → maintains concentration gradient.
3. Moist surface → gases dissolve for easier diffusion.
(b)(iv) Description including three of:
• Use limewater or hydrogen carbonate indicator.
• Measure time for limewater to go cloudy / indicator to change.
• Compare results with and without exercise / before and after.
• Control variables (same volume, temperature, person).
• Repeat and calculate mean.
▶️ Answer/Explanation
(a)(i) C (maltose)
(a)(ii) C (2 and 3 only)
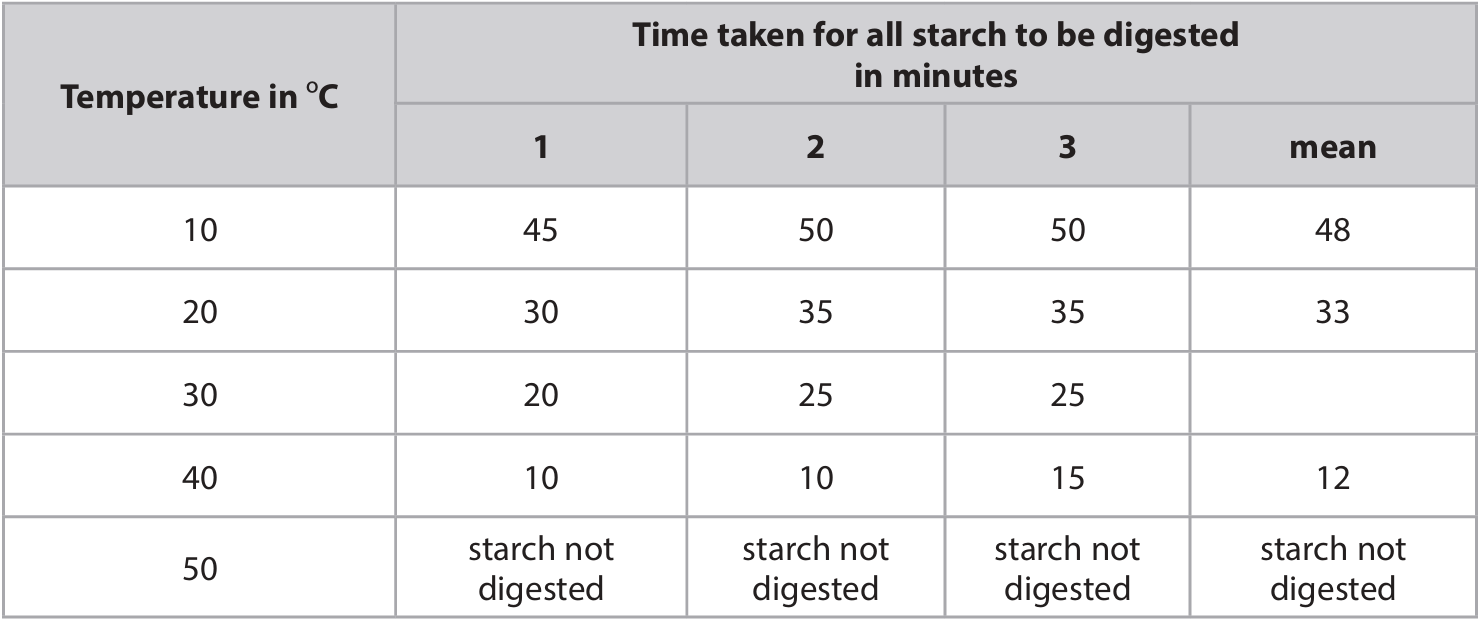
(b)(i) to reach temperature / bring to temperature / make sure at 10°C / equilibrate / warm up
(b)(ii) • add iodine (solution) (1)
• black / (dark) blue (colour) (1)
(c)(i) \(\frac{20 + 25 + 25}{3} = \frac{70}{3} = 23.333…\)
Mean time = 23 minutes (to two significant figures)
(c)(ii) An explanation that makes reference to two of the following:
• increased (kinetic) energy (1)
• faster movement (of enzyme and substrate) / more collisions / greater rate of collisions / more enzyme-substrate complexes (1)
• reaches optimum temperature for enzymes (1)
(c)(iii) An explanation that makes reference to two of the following:
• enzyme denatures / amylase denatures (1)
• active site changes shape / enzyme is not complementary to substrate (1)
• substrate / starch no longer binds / fits (1)
(c)(iv) An explanation that makes reference to two of the following:
• use smaller temperature intervals / use 5°C intervals / use 1°C intervals (1)
• between 30 and 40 / between 30 and 50 / between 40 and 50 / the rate may be faster at temperatures above or below 40 / optimal may not be at 40 (1)
• use smaller time intervals (1)
• as similar recorded times may actually be different (1)
▶️ Answer/Explanation
(a)(i) C (2 and 3 only)
A is incorrect because chitin is not present in either.
B is incorrect because chitin is not present in either.
D is incorrect because both have chloroplasts.
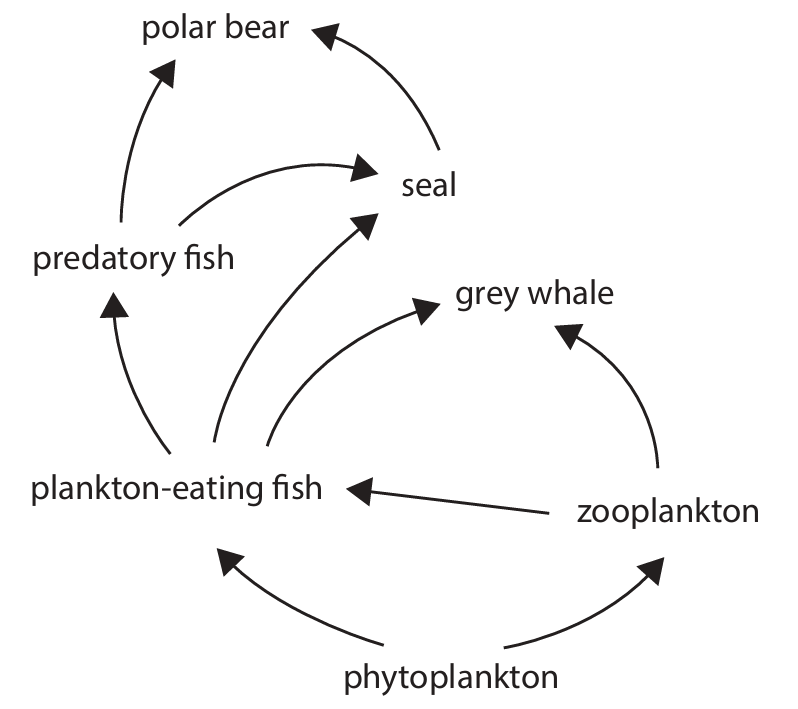
(a)(ii) Any two of: polar bear, seal, grey whale, predatory fish.
(a)(iii) phytoplankton → zooplankton → plankton-eating fish → predatory fish → seal → polar bear
One mark for correct organisms in order. One mark for correct arrow direction.
(b)(i) 950%
Working:
Increase = \(12.6 – 1.2 = 11.4\ \text{mg per dm}^3\)
Percentage Increase = \(\frac{11.4}{1.2} \times 100 = 950\%\)
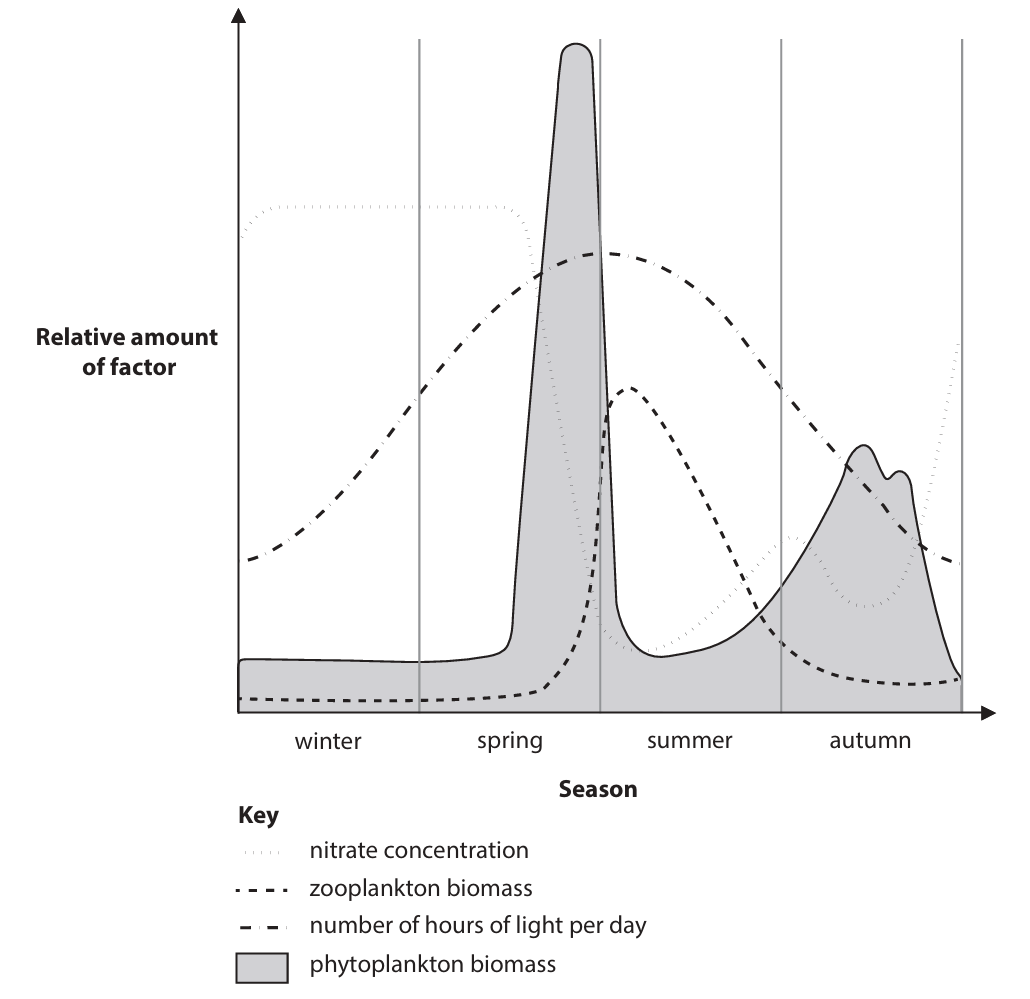
(b)(ii) An answer that makes reference to points such as:
• Phytoplankton biomass is low in winter due to low light and temperature, reducing photosynthesis.
• Biomass increases in spring as light intensity and duration increase, enhancing photosynthesis.
• Increased photosynthesis produces more glucose, allowing phytoplankton growth.
• Zooplankton biomass increases after phytoplankton increase, as they feed on phytoplankton.
• Phytoplankton decrease in late summer/autumn as zooplankton population peaks and consume them, and light/nitrate levels fall.
• Nitrate concentration decreases in spring/summer as phytoplankton absorb nitrates to make amino acids and proteins.
• The biomass of both is limited by abiotic factors (light, nitrates) and biotic factors (predation).

▶️ Answer/Explanation
(a) A description that makes reference to four of the following points:
- receptor (generates impulse) / eq (1)
- (impulse) passes along sensory neurone (to relay / motor neurone / to CNS / spinal cord) (1)
- (sensory / relay / CNS / spinal cord) to motor neurone (1)
- to muscle / effector (1)
- crosses synapses (1)
- (using) neurotransmitters (1)
(b)(i) Graph marking points:
- S: linear scales for both axes (1)
- L: straight line joining points (1)
- A: axes correct way round (stimulus number on x-axis, time on y-axis) (1)
- A: axes both labelled, and with units on y axis (Time/seconds) (1)
- P: points plotted correctly (1)
(Graph should show a general decrease in time with increasing stimulus number, with a steeper decline after stimulus 5/6).
(b)(ii) A description that makes reference to the following points:
- (time) decreases / gets less / becomes shorter / eq (1)
- falls (more steeply) after 5 / from 6 touches / small decrease until 5 or 6 / eq (1)
(b)(iii) An explanation that makes reference to two of the following points:
- (few stimuli) could represent danger / allow escape / escapes predator / snail not eaten / helps snail survive / eq (1)
- (repeated stimuli) suggests no danger / no longer represents danger / snail recognises there is no threat / has learnt that there is no danger / eq (1)
- (when not staying in shell) snail can eat for longer / can continue moving / does not waste energy / eq (1)

▶️ Answer/Explanation
(a)(i) An explanation that makes reference to four of the following points (marked in pairs):
- Artery wall has a thick layer of elastic tissue / more elastic (1) as blood pressure is higher / for the wall to recoil / to expand / to smooth blood flow (1).
- Artery wall has a thick layer of muscle / more muscle (1) to control blood flow (1).
- Artery has no valves (1) as blood pressure is sufficient to prevent backflow (1).
Accept converse statements for veins. Credit thick wall due to high pressure (two marks) if other points are not given.
(a)(ii) An explanation that makes reference to three of the following points:
- The artery in CHD has a blockage / is narrower / has a narrower lumen (1).
- Less blood / less oxygen can flow to the heart muscle (1).
- This leads to less aerobic respiration / more anaerobic respiration (1).
- Less energy / less ATP is produced (1).
- Therefore, the heart is unable to beat faster / contract as effectively during exercise (1).
(b)(i) An answer that makes reference to one of the following:
- High cholesterol / high-fat diet (1)
- Lack of exercise (1)
- Stress (1)
- High salt diet (1)
- High BMI / obesity (1)
- Diabetes (1)
- Age (1)
- Sex (1)
- High blood pressure (1)
Ignore “diet”, “bad diet”, “unbalanced diet” without specific link.
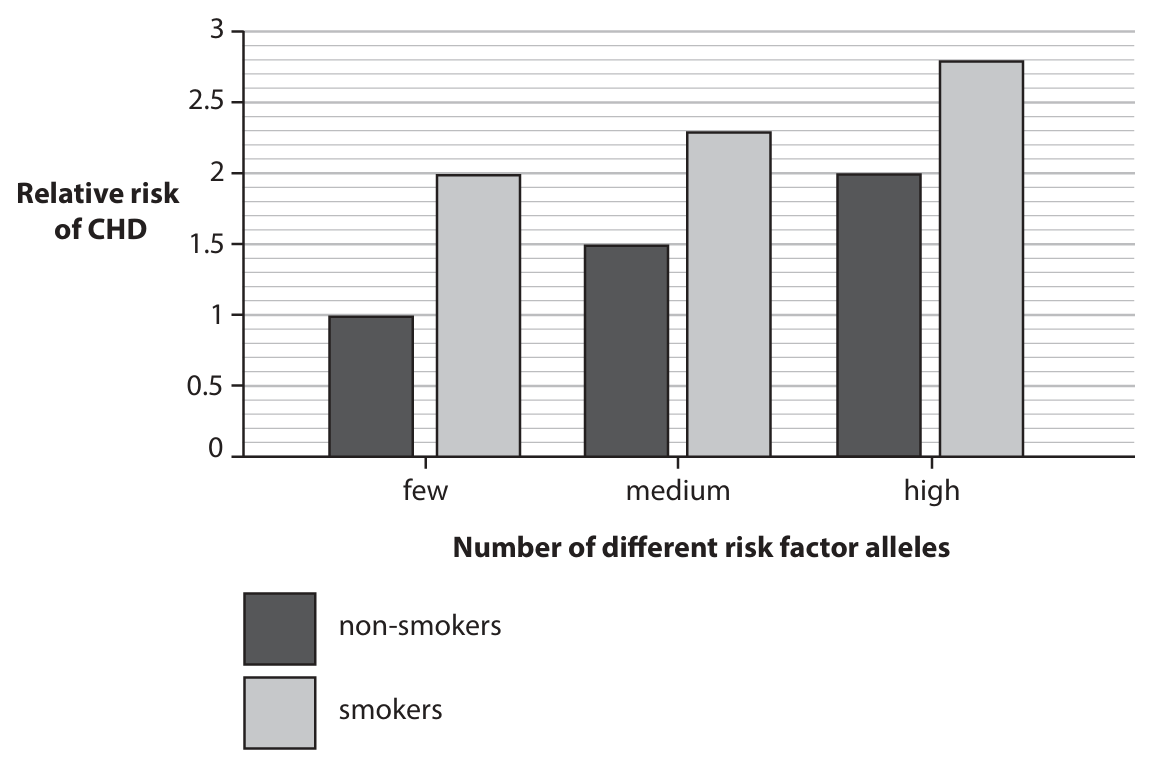
(b)(ii) An answer that makes reference to five of the following points:
- Smoking increases the risk of CHD for all allele groups (1).
- Having more risk factor alleles increases the risk of CHD (1).
- The highest risk is for smokers with a high number of alleles / The lowest risk is for non-smokers with few alleles (1).
- The biggest increase in risk from smoking is seen in those with few risk alleles / The increase from smoking is lower for the medium or high allele groups (1).
- Smokers with few alleles have a similar risk to non-smokers with many alleles (1).
- Credit use of data, e.g., smoking increases risk by approximately 1 for the low allele group (1).
- Carbon monoxide in cigarette smoke contributes to CHD (1).
- Smoking causes plaque / cholesterol build-up / blocks the coronary artery (1).
- Limitation: group size / sample size may be small (1).
- Limitation: other factors like age, sex, diet, frequency of smoking were not considered (1).
Accept: The increase in risk from smoking is similar for medium and high allele groups.

▶️ Answer/Explanation
(a)(i)
An answer that makes reference to the following points:
- Correct genotypes of parents (Dd, dd) (1)
- Correct gametes (D or d, d) (1)
- Correct genotypes of offspring (Dd, dd) (1)
- Correct probability of \( 0.5 \) / 50% / \( \frac{1}{2} \) (1)
Example genetic diagram:
Parents: Dd (Individual 4) × dd (Individual 5)
Gametes: D, d from parent 4; d, d from parent 5
Offspring genotypes: Dd, Dd, dd, dd
Probability of lactose intolerant child (dd) = \( \frac{2}{4} = \frac{1}{2} \) (50%)
(a)(ii)
An answer that makes reference to two of the following:
- Less water absorbed (into blood) (1)
- By colon / intestine (1)
- As sugar / lactose is not absorbed (1)
- (As lactose) affects osmosis / lowers water potential (1)
- (Lactose could cause) bacteria to grow / bacteria break down lactose (1)
(a)(iii)
An explanation that makes reference to four of the following points:
- Mutation (occurred) (1)
- Creating (genetic) variation (1)
- People with lactose tolerance (DD or Dd) can drink milk / did not get diarrhoea / can gain extra nutrients / were able to compete better / survived / had a selective advantage (1)
- Reproduced (more) / produced offspring (1)
- Pass on allele / gene / mutation (1)
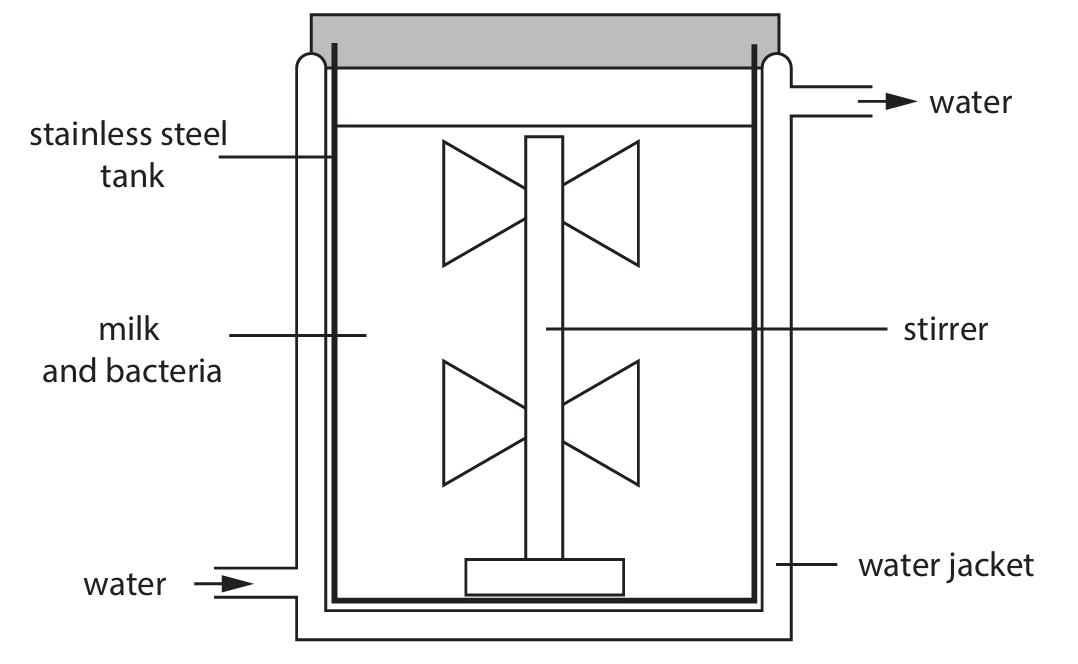
(b)(i)
An explanation that makes reference to the following points:
- Mixes the contents / spreads nutrients / maintains even consistency / prevents settling (1)
- Maintains even temperature / prevents hot spots / maintains an even pH (1)
(b)(ii)
An explanation that makes reference to two of the following:
- Removes heat / cools the fermenter (1)
- To maintain optimal temperature (1)
- Prevents enzymes denaturing / prevents death of bacteria (1)
▶️ Answer/Explanation
(a) A description that makes reference to the following points:
- Plasmid (used) as vector (1).
- Restriction enzyme used to cut out gene / cut plasmid / cut DNA (1).
- Ligase used to insert gene into plasmid / stick DNA / glue DNA / stick gene with DNA (1).
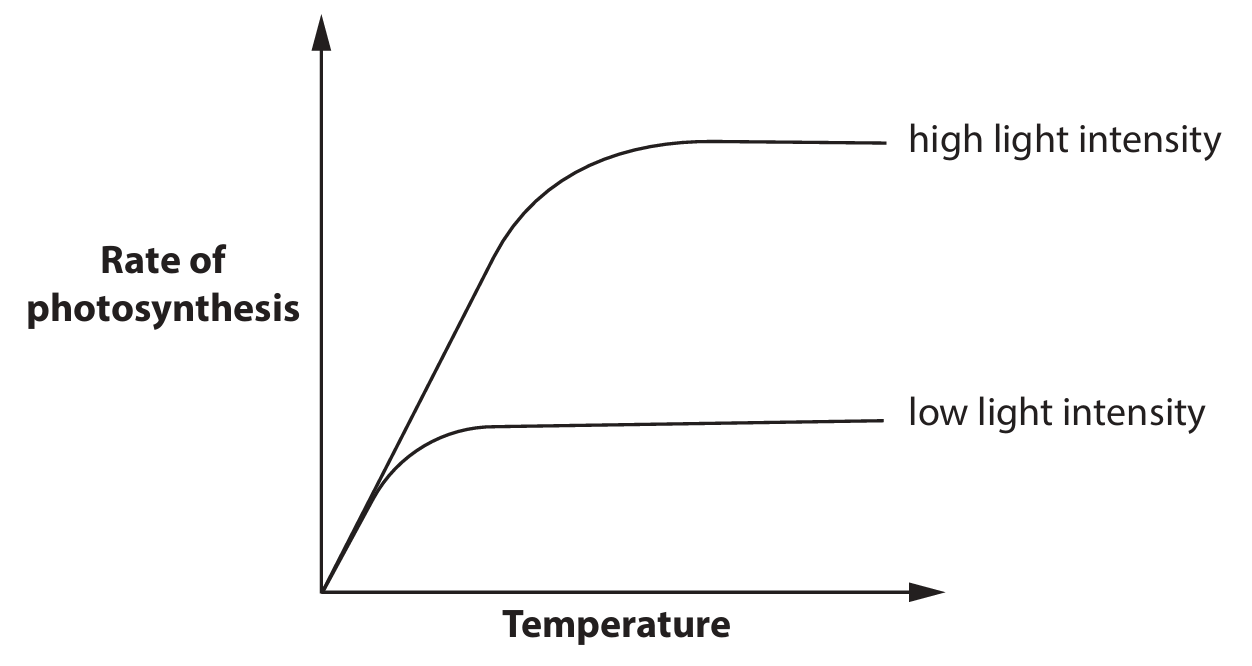
(b) An explanation that makes reference to three of the following points:
- Increasing temperature increases the rate of photosynthesis (1).
- Because particles have more (kinetic) energy / more frequent collisions / there is more enzyme activity (1).
- (At low light intensity rate levels off) so light is limiting (1).
- (At high light intensity) carbon dioxide limits rate / not enough carbon dioxide (1).
- (At high light intensity) rate levels off because temperature is no longer limiting / other factors become limiting (1).
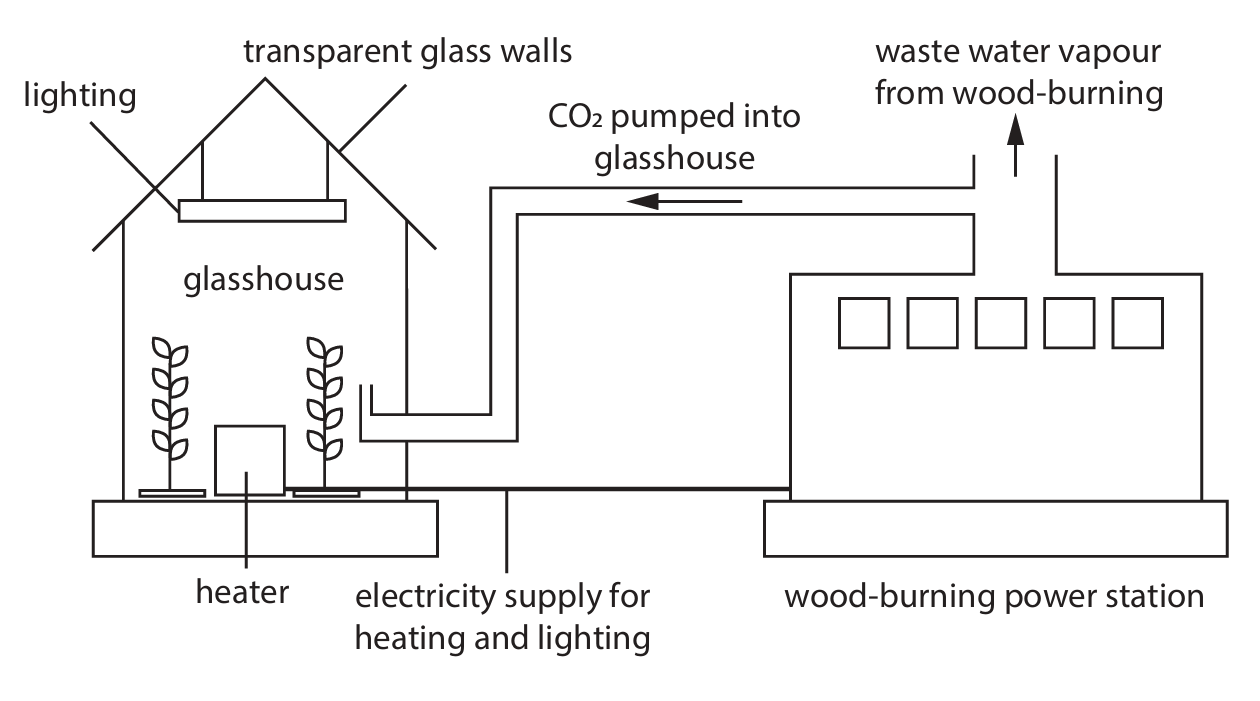
(c) An answer that makes reference to five of the following points:
- Light, carbon dioxide and (warm) temperature are supplied / provided (1).
- Therefore no factors for photosynthesis are limiting / all factors present for photosynthesis / there is more photosynthesis (1).
- So high yield / fast production / (to give high profit) / more tomatoes (1).
- No need to buy carbon dioxide / no need to buy electricity / wood is cheaper than fossil fuel / wood cheaper than buying electricity (1).
- Tomatoes protected from pests / disease / frost / cold / bad weather (1).
- Wood is renewable (energy) (1).
- Less use of fossil fuel (1).
- Carbon dioxide not released into atmosphere / is reused (1).
- Less greenhouse effect / less climate change / less ice cap melting (1).
- Less release of sulfur dioxide / less acid rain (1).
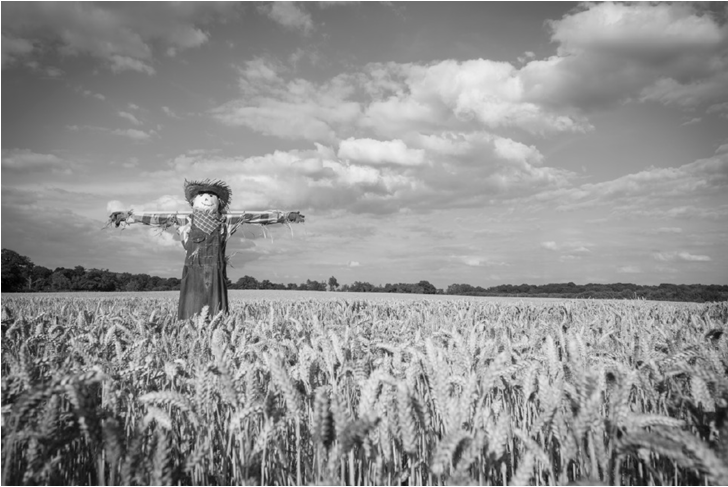
▶️ Answer/Explanation
Answer that makes reference to six of the following points:
- C (Change): Change the colour of the scarecrow’s clothes (e.g., use red, blue, yellow, green, etc.) as the independent variable.
- O (Other variables controlled): Keep the type/size of scarecrow, fabric, clothing size, and position in the field the same.
- R (Repeat/Reliability): Repeat the experiment multiple times for each colour and calculate averages to ensure reliability.
- M1 (Measurement 1): Measure the dependent variable, e.g., count the number of birds in the field, or measure the mass of crop eaten/remaining.
- M2 (Measurement 2): Carry out measurements over a stated, consistent period of time (e.g., one week per colour).
- S1 (Standardization 1): Control environmental factors such as time of year, weather, time of day, wind speed, and light intensity.
- S2 (Standardization 2): Use the same crop type, field area, soil quality, and avoid using pesticides or fertilisers during the experiment.
Example full-sentence answer structure:
“I would use several identical scarecrows and dress them in clothes of different colours (e.g., red, blue, yellow, green). I would place each scarecrow in a separate but identical field plot growing the same crop, at the same time of year, for one week. I would count the number of birds seen in each plot at the same time each day and also measure the mass of crop remaining at the end of the week. I would repeat the experiment with each colour three times and calculate an average. All other factors like scarecrow size, weather conditions, and field size would be kept the same to make it a fair test.”