▶️ Answer/Explanation
(a)
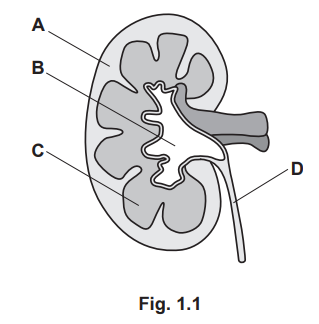
Explanation: The letters correspond to kidney structures: A (renal cortex), B (renal medulla), C (renal pelvis), and D (ureter). The table is completed by matching each description to the correct structure(s). For example, “contains glomeruli” applies to the cortex (A), while “collects urine” refers to the renal pelvis (C).
(b)
Explanation: Aquaporins are water channel proteins in the collecting duct and distal convoluted tubule. They increase membrane permeability to water, allowing reabsorption into the blood when ADH is present. This regulates urine concentration based on hydration needs.
(c)
Explanation: When blood water potential rises (e.g., after drinking), hypothalamic osmoreceptors detect the change and reduce ADH secretion from the posterior pituitary. Less ADH decreases aquaporin insertion in the kidney, producing dilute urine to restore balance.
▶️ Answer/Explanation
(a)(i)
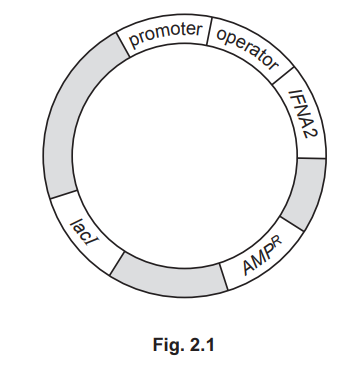
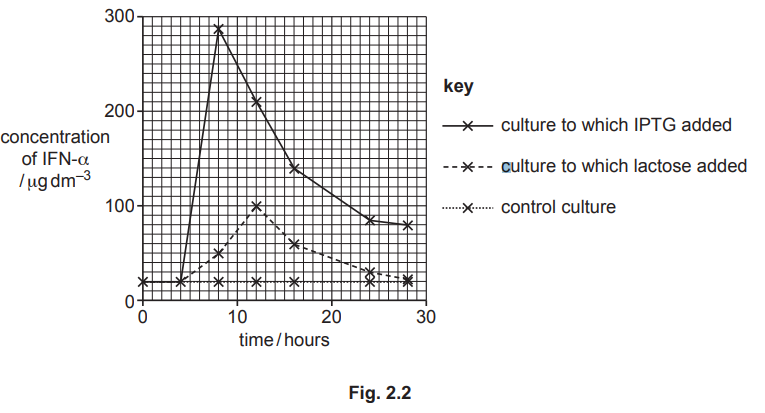
Explanation: The lacI gene codes for the lac repressor protein, which binds to the operator region of the lac operon in the absence of an inducer (allolactose or IPTG). Between 0–4 hours, the repressor prevents RNA polymerase from binding to the promoter, inhibiting transcription of IFNA2.
(a)(ii)
Explanation: After IPTG addition at 4 hours: (1) IFN-α concentration rises steeply, peaking at 8 hours. (2) The concentration then declines gradually but remains above baseline by 28 hours. (3) The peak concentration (~0.8 μg mL−1) is higher than the initial level (~0.1 μg mL−1).
(a)(iii)
Explanation: IPTG yields higher IFN-α than lactose because: (1) IPTG is not metabolized by E. coli, maintaining a constant concentration, whereas lactose is broken down into glucose and galactose. (2) IPTG binds more stably to the repressor.
(a)(iv)
Explanation: The decline after 12 hours may occur due to IFN-α degradation or depletion of cellular resources (e.g., amino acids) for protein synthesis.
(b)
Explanation: \(AMP^R\) allows selection of transformed E. coli by growing them on ampicillin-containing medium. Only bacteria with the plasmid (and \(AMP^R\)) survive.
(c)
Explanation: Antibiotic resistance evolves via: (1) Random mutations in bacterial DNA (e.g., in drug target genes). (2) Selection pressure from antibiotics favors resistant mutants. (3) Resistant bacteria survive and reproduce. (4) Resistance genes spread via horizontal gene transfer (conjugation/transduction). (5) Overuse of antibiotics accelerates this process.
▶️ Answer/Explanation
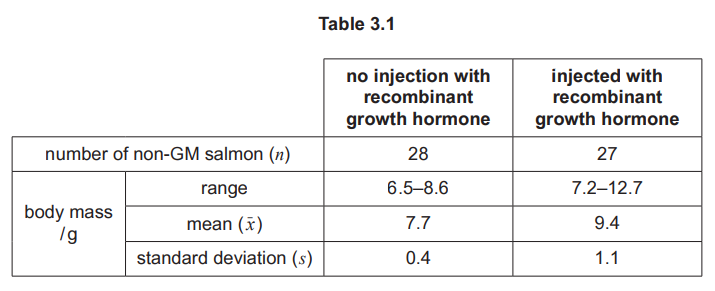
(a) Continuous variation shows a range of intermediate phenotypes (e.g., body mass) that follow a normal distribution. It’s caused by polygenic inheritance (many genes with additive effects) and environmental influences.
Explanation: Unlike discrete traits (e.g., blood type), continuous traits like body mass have many possible values because multiple genes and environmental factors (e.g., food availability) contribute.
(b)(i) Calculation of t-value:
\[ t = \frac{|7.7 – 9.4|}{\sqrt{\frac{0.4^2}{28} + \frac{1.1^2}{27}}} = \frac{1.7}{\sqrt{0.0057 + 0.0448}} = \frac{1.7}{0.2249} = 7.56 \]
Explanation: The large t-value (7.56) indicates a significant difference between the groups. This is calculated by comparing the means (7.7g vs 9.4g) while accounting for sample sizes and variances.
(b)(iii) GM salmon don’t require weekly injections, reducing stress and infection risks.
Explanation: Genetic modification provides continuous hormone production internally, eliminating the need for repeated handling and injections that can stress fish and introduce pathogens.
▶️ Answer/Explanation
(a)
- Extract DNA from the individual’s cells/tissue.
- Fragment the DNA using restriction enzymes.
- Denature DNA into single strands and label with fluorescent dyes.
Explanation: The DNA must be isolated, cut into manageable pieces, and tagged for hybridization with microarray probes.
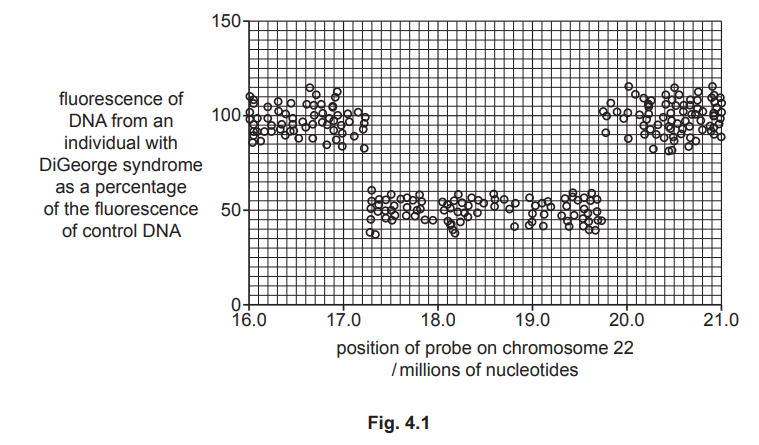
(b)(i) 2,400,000 or 2,500,000 nucleotides.
Explanation: The fluorescence drops to ~50% between ~18.5M and ~21M nucleotides, indicating a deletion of ~2.5M nucleotides.
(b)(ii)
- DiGeorge and control DNA are labeled with different fluorescent dyes.
- DNA hybridizes to complementary probes on the microarray.
- Deletions reduce fluorescence (50%) compared to control (100%).
Explanation: The microarray detects deletions by comparing fluorescence intensities between test and control DNA at specific probe locations.
(b)(iii)
- Variable deletion sizes (800k–3.1M nucleotides) affect different genes.
- Heterozygosity: Remaining alleles may be dominant/recessive.
- Environmental factors influence phenotypic expression.
Explanation: Phenotypic variability arises from differences in deleted gene content, allelic interactions, and external factors.
▶️ Answer/Explanation
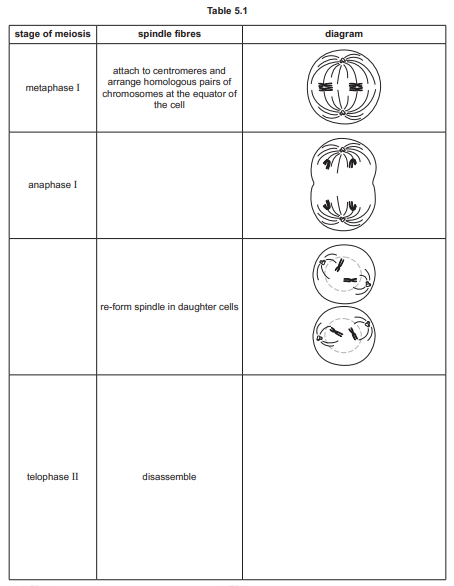
(a)
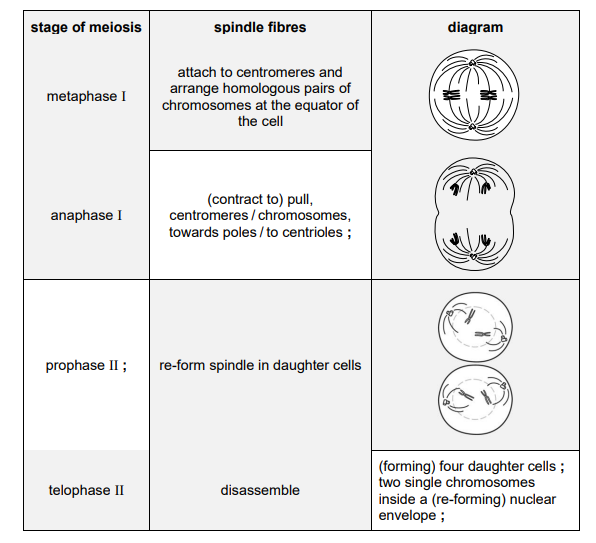
Explanation:
- Anaphase I: Spindle fibres shorten, pulling homologous chromosomes to opposite poles.
- Spindle re-formation: Occurs during prophase II in daughter cells.
- Telophase II diagram: Shows four haploid cells with unpaired chromosomes (no labels required).
(b)
Answer:
- Meiosis produces haploid gametes (n) for sexual reproduction.
- Fertilization combines two gametes (n + n) to form a diploid zygote (2n).
- Maintains species’ chromosome number across generations.
- Prevents polyploidy (excessive chromosome doubling) in offspring.
Explanation: Reduction division ensures genetic stability by halving chromosome number in gametes, allowing restoration of diploidy upon fertilization. This prevents chromosomal aberrations and maintains biodiversity.
▶️ Answer/Explanation
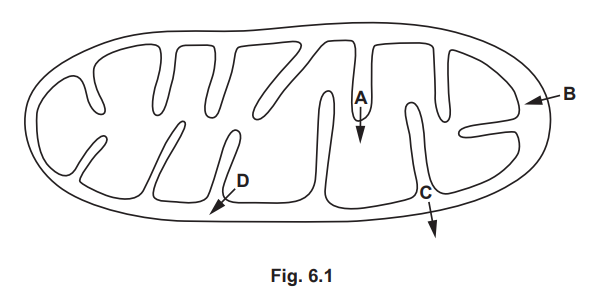
(a)(i) D
Explanation: Arrow D represents the active transport of protons (\(H^+\)) from the mitochondrial matrix into the intermembrane space. This process requires energy (ATP) and is crucial for establishing the proton gradient used in chemiosmosis.
(a)(ii) C and D
Explanation: Carbon dioxide (\(CO_2\)), a byproduct of respiration, diffuses out of the mitochondrion. Arrow C shows \(CO_2\) diffusing from the matrix to the intermembrane space, while arrow D (in reverse) indicates \(CO_2\) exiting the mitochondrion entirely.
(b) Role of the Mitochondrial Matrix:
Explanation: The mitochondrial matrix is the site of key metabolic processes:
1. Link Reaction & Krebs Cycle: Pyruvate is decarboxylated and converted into acetyl-CoA, which enters the Krebs cycle to generate reduced NAD and FAD.
2. Protein Synthesis: Contains DNA and ribosomes to produce enzymes (e.g., dehydrogenases) essential for respiration.
3. Substrate-Level Phosphorylation: Direct ATP production occurs during the Krebs cycle (e.g., via succinyl-CoA synthetase).
(c) Effect of Oxygen Lack on Oxidative Phosphorylation:
Explanation: Oxygen is the final electron acceptor in the electron transport chain (ETC). Without it:
1. ETC Stops: Electrons cannot be passed to oxygen, halting electron flow.
2. No Proton Gradient: \(H^+\) ions are not pumped into the intermembrane space, preventing chemiosmosis.
3. ATP Production Ceases: No ATP is synthesized via ATP synthase.
4. NAD/FAD Accumulation: Reduced NAD and FAD cannot be recycled, inhibiting earlier respiration stages.
▶️ Answer/Explanation
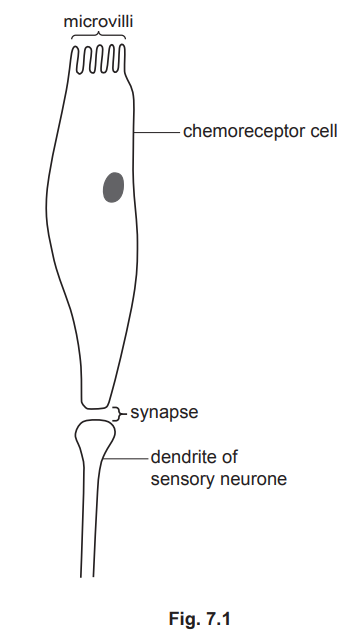
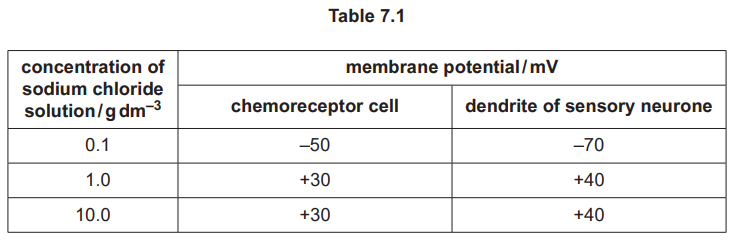
(a)
Explanation: At \(10.1 \, \mathrm{g \, dm}^{-3}\), the chemoreceptor membrane does not depolarize (stays at \(-50 \, \mathrm{mV}\)), so no neurotransmitter is released, and the sensory neurone remains at resting potential (\(-70 \, \mathrm{mV}\)). At higher concentrations (\(31.0 \, \mathrm{g \, dm}^{-3}\)), the chemoreceptor depolarizes, releasing neurotransmitter, which triggers depolarization (action potential) in the sensory neurone. The response follows the all-or-nothing law, where a threshold must be crossed for an impulse to be generated.
(b)
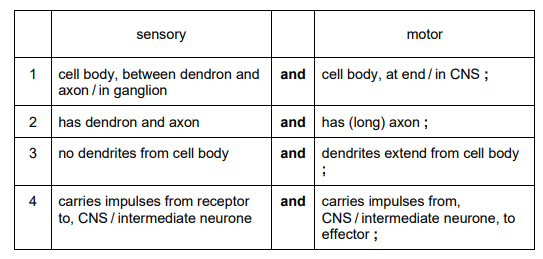
Explanation: Sensory neurones transmit impulses from receptors to the CNS, while motor neurones carry impulses from the CNS to effectors. Structurally, sensory neurones have long dendrites and short axons, whereas motor neurones have short dendrites and long axons. Additionally, sensory neurones are unipolar, while motor neurones are multipolar.
▶️ Answer/Explanation
(a)
Explanation: The internal membranes (thylakoids) of the chloroplast play key roles in photosynthesis:
- They contain photosynthetic pigments (e.g., chlorophyll) to absorb light energy.
- They house photosystems I & II and the electron transport chain for light-dependent reactions.
- They facilitate photolysis (splitting of water) and ATP synthesis via chemiosmosis.
- Their stacked structure (grana) increases surface area for efficient light absorption.
(b)
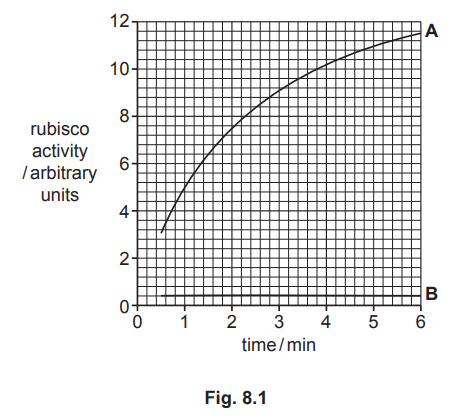
Description of Results:
- Tube A (with RA) shows a steady increase in rubisco activity over time (e.g., from ~3.0 to ~11.5 units).
- Tube B (without RA) maintains constant low activity (~0.4 units).
Explanation: RA activates rubisco by modifying its active site, enabling better binding with RuBP and faster product release. This explains the rising activity in Tube A, while Tube B lacks this activation mechanism.
▶️ Answer/Explanation
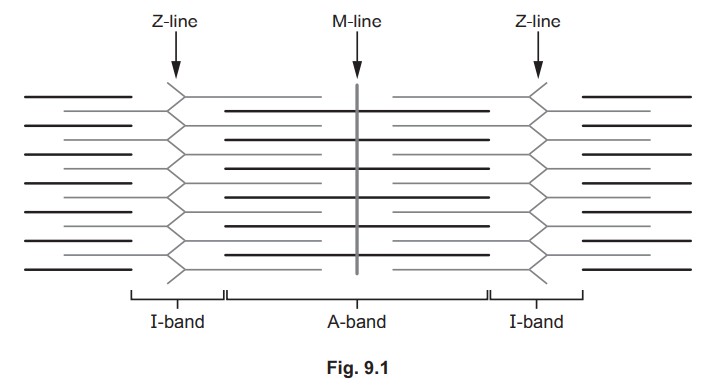
(a)(i) P pointing to thin filament (actin); R pointing to thick filament (myosin).
Explanation: Actin filaments (P) are the thinner filaments, while myosin filaments (R) are the thicker filaments in the sarcomere.
(a)(ii) A-band – stays the same; I-band – gets narrower.
Explanation: The A-band remains constant as it represents the length of the myosin filament, while the I-band shortens during contraction as actin filaments slide over myosin.
(b)(i) Curare competes with acetylcholine, blocking receptors and preventing depolarization. This inhibits \( \mathrm{Na}^+ \) channel opening, \( \mathrm{Ca}^{2+} \) release, and muscle contraction.
Explanation: Curare acts as a competitive inhibitor at neuromuscular junctions, disrupting the signal for muscle activation.
(b)(ii) Curare can cause death by paralyzing respiratory muscles (ribs/diaphragm) or cardiac muscles, leading to suffocation or heart failure.
Explanation: Without muscle function, essential processes like breathing and circulation cease, resulting in fatality.
▶️ Answer/Explanation
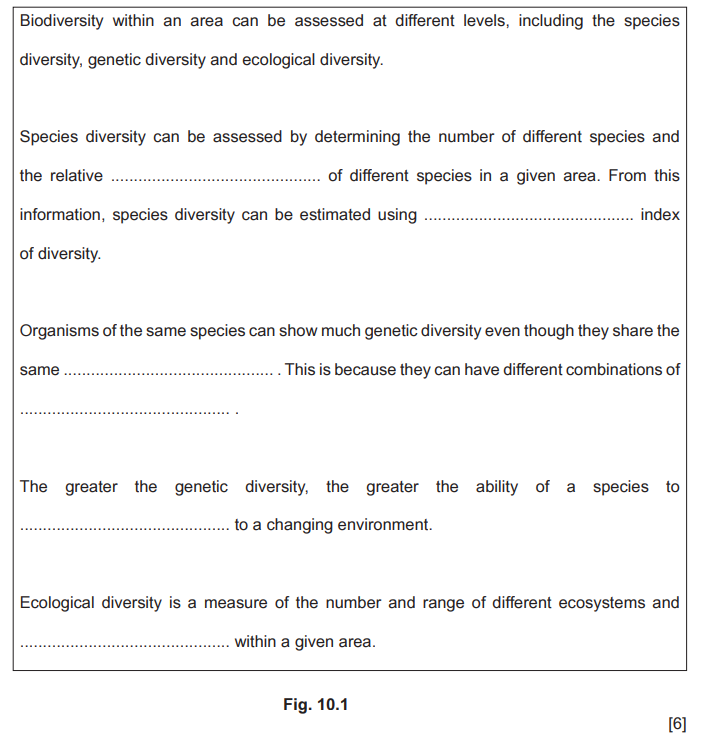
(a)
abundance / numbers / population (size);
Simpson’s;
genes;
alleles;
adapt / evolve;
habitats / niches;
Explanation: The passage describes biodiversity, which includes the abundance of species, Simpson’s diversity index, genetic diversity (genes and alleles), and the ability of species to adapt to different habitats.
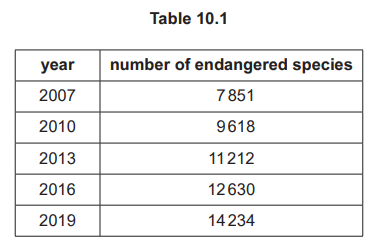
(b)(i)
\[ \begin{aligned} & \text{Rate of increase} = \frac{14234 – 7851}{12} \\ & = \frac{6383}{12} \\ & = 532 \text{ per year (to the nearest whole number).} \end{aligned} \]
Explanation: The total increase in endangered species from 2007 to 2019 is \(14234 – 7851 = 6383\). Dividing this by 12 years gives an annual rate of \(532\) species per year.
(b)(ii)
More fish species are endangered due to overfishing, habitat destruction (e.g., coral reef degradation), pollution (e.g., plastic waste), and climate change affecting aquatic ecosystems. Mammals may have better conservation efforts or slower reproductive rates, making fish more vulnerable.
Explanation: Fish face greater anthropogenic pressures, such as unsustainable fishing practices and marine pollution, while mammals often benefit from targeted conservation programs and public awareness.