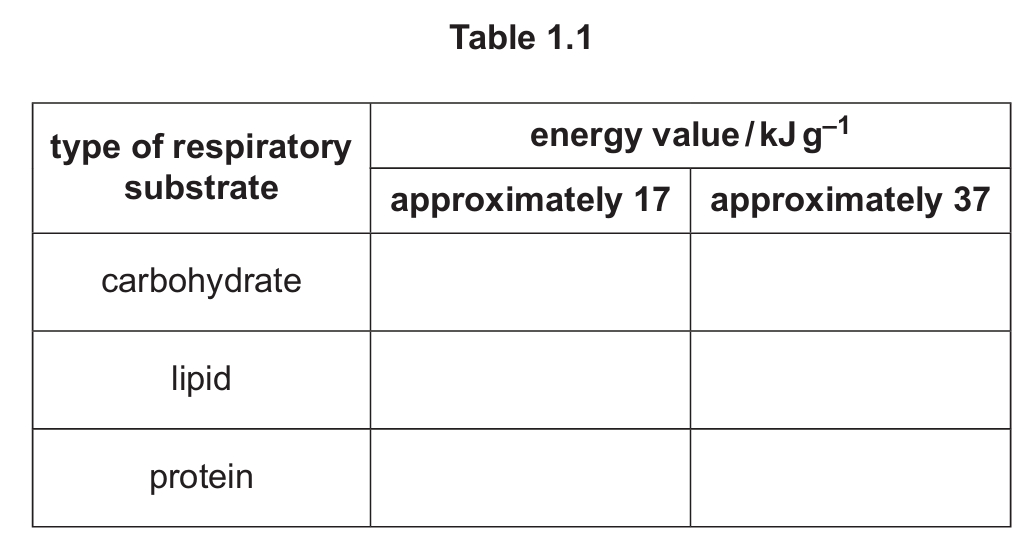
(a) Different types of respiratory substrate can have different energy values and therefore release different quantities of energy when they are respired.
Complete Table 1.1 to show the energy value of each of the three main types of respiratory substrate.
Use one tick (✓) to identify which of the two possible energy values is correct for each respiratory substrate.
(b) Determining the respiratory quotient (RQ) of an organism can be used to indicate the main type of respiratory substrate that is being metabolised in respiration. This is because the different types of respiratory substrate have different RQ values. Table 1.2 shows typical RQ values for carbohydrate, lipid and protein.
| type of respiratory substrate | RQ value |
|---|---|
| carbohydrate | 1.0 |
| lipid | 0.7 |
| protein | 0.8 |
(i) State the name of the laboratory apparatus that can be used to determine the RQ value of organisms such as blowfly larvae.
(ii) When determining RQ values using the laboratory apparatus stated in (b)(i), chemicals such as soda lime or potassium hydroxide solution are used.
State the reason for using chemicals such as soda lime or potassium hydroxide solution when measuring RQ values.
(c) Organic acids such as malic acid can also act as respiratory substrates. When respired aerobically, their RQ values may be different to the RQ values of the main respiratory substrates.
Fig. 1.1 shows the formula that is used to calculate RQ values.
\[RQ = \frac{\text{number of molecules of carbon dioxide produced}}{\text{number of molecules of oxygen taken in}}\]
When malic acid is respired aerobically, the equation is:
\[C_4 H_6 O_5 + …… O_2 \rightarrow 4CO_2 + 3H_2O + \text{energy}\]
(i) Calculate how many molecules of oxygen are taken in when one molecule of malic acid is respired aerobically.
(ii) Calculate the RQ for malic acid.
Give your answer to two decimal places.
(d) The deer mouse, Peromyscus maniculatus, lives in forests in North America.
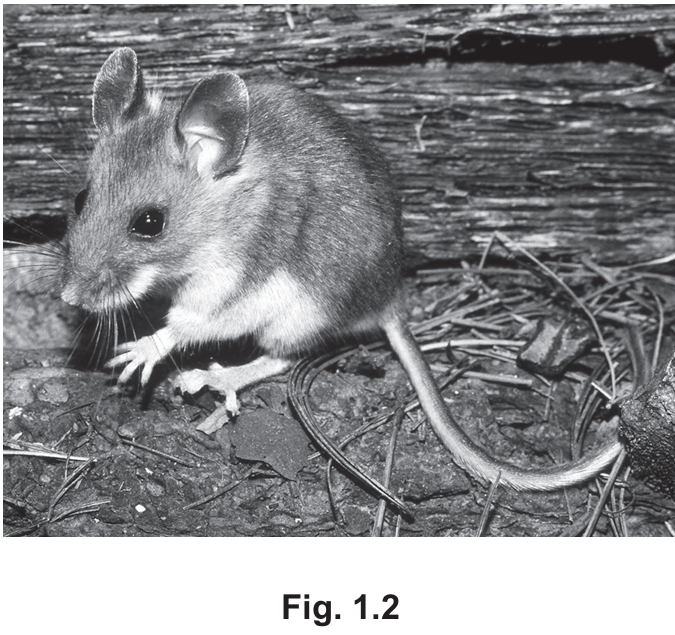
The deer mouse is active throughout the year and is much more active during the night than during the day.
At certain times of the year, deer mice spend a number of hours during the day in a physiologically controlled state of inactivity (not active), known as torpor. During this time there is a decrease in metabolic rate.
Fig. 1.3 is a graph showing the RQ of a deer mouse from 6:00 to 22:00 on a day that included time in torpor.
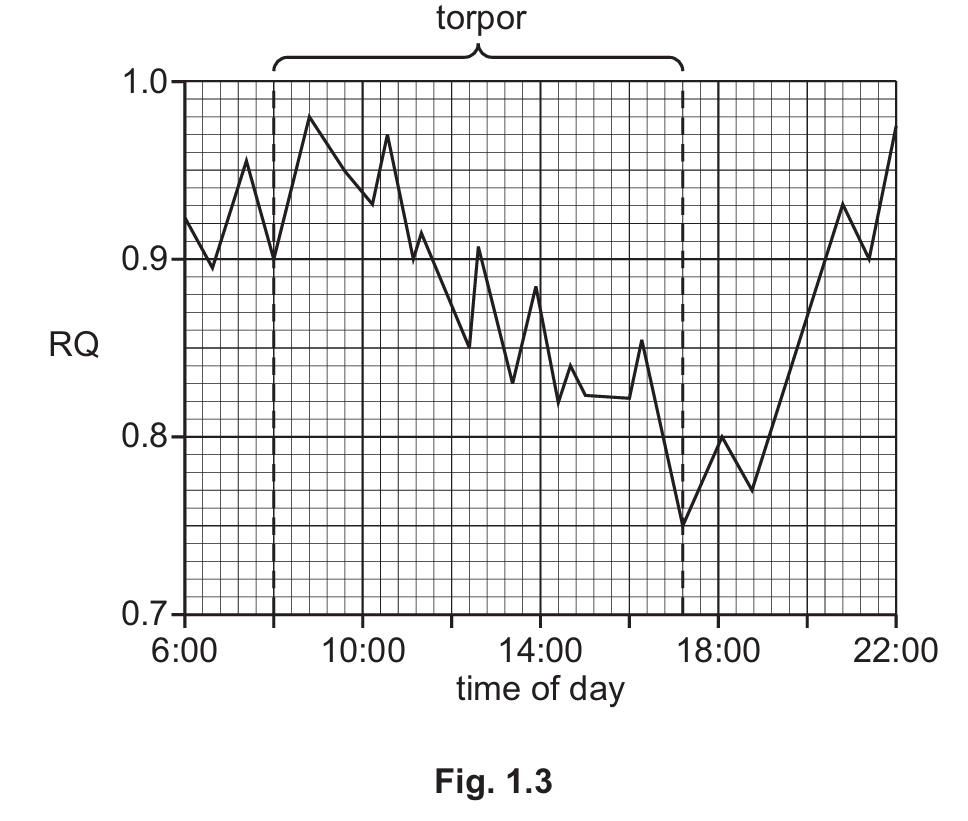
(i) Describe the trend shown during torpor in Fig. 1.3 and suggest an explanation for this trend.
(ii) Deer mice have a daily period of torpor only at certain times of the year.
Suggest reasons why a deer mouse enters torpor only at certain times of the year.
▶️ Answer/Explanation
(a)
| type of respiratory substrate | approximately 17 | approximately 37 |
|---|---|---|
| carbohydrate | ✓ | |
| lipid | ✓ | |
| protein | ✓ |
Carbohydrates release approximately 17 kJ/g, lipids release approximately 37 kJ/g, and proteins release approximately 17 kJ/g when respired.
(b)(i) respirometer
A respirometer is used to measure the rate of respiration by measuring oxygen consumption and carbon dioxide production.
(b)(ii) to absorb/remove carbon dioxide
Chemicals like soda lime or potassium hydroxide solution are used to absorb carbon dioxide produced during respiration, allowing accurate measurement of oxygen consumption.
(c)(i) 3
Balancing the equation: \(C_4H_6O_5 + 3O_2 \rightarrow 4CO_2 + 3H_2O\). There are 4 carbon atoms on the left (in malic acid) and 4 on the right (in CO₂), 6 hydrogen atoms on both sides, and 5+6=11 oxygen atoms on the left (5 in malic acid + 6 in O₂) matching 8+3=11 on the right (8 in CO₂ + 3 in H₂O).
(c)(ii) 1.33
Using the RQ formula: \(RQ = \frac{CO_2 \text{ produced}}{O_2 \text{ consumed}} = \frac{4}{3} = 1.33\) (to two decimal places).
(d)(i)
During torpor, the RQ value falls from about 0.9 at the start (8:00) to about 0.75 at the end (17:12). This suggests a shift from carbohydrate metabolism to lipid/protein metabolism, as lipids and proteins have lower RQ values (0.7 and 0.8 respectively). The mouse may be using stored lipids/proteins as energy sources during this inactive period.
(d)(ii)
Possible reasons include:
- During winter/cold weather when food is limited, to conserve energy and reduce heat loss
- During summer/hot weather to conserve water and prevent overheating
- To avoid predation during vulnerable periods
The orca, Orcinus orca, has the largest distribution of all aquatic mammals and is found in nearly all seas and oceans. Orca are social mammals that usually live in groups. These groups can vary in size.
Fig. 2.1 shows an orca.
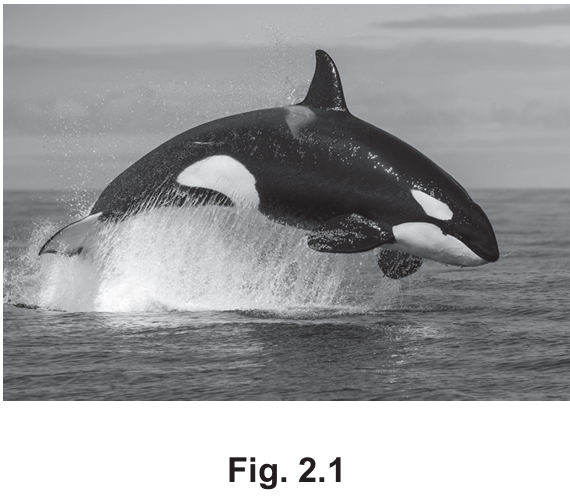
There are a number of distinct types of orca. These distinct types of orca are classified as members of the same species. However, there is evidence that sympatric speciation is occurring.
(a) (i) There are two distinct types of orca in the Northeast Atlantic Ocean: Type 1 and Type 2. Type 1 orca feed mainly on fish. Type 2 orca feed mainly on aquatic mammals, such as seals.
Fig. 2.2 shows the locations in the Northeast Atlantic Ocean where Type 1 orca and Type 2 orca have been observed. Orca do not occur only in these areas and some groups of orca travel great distances.
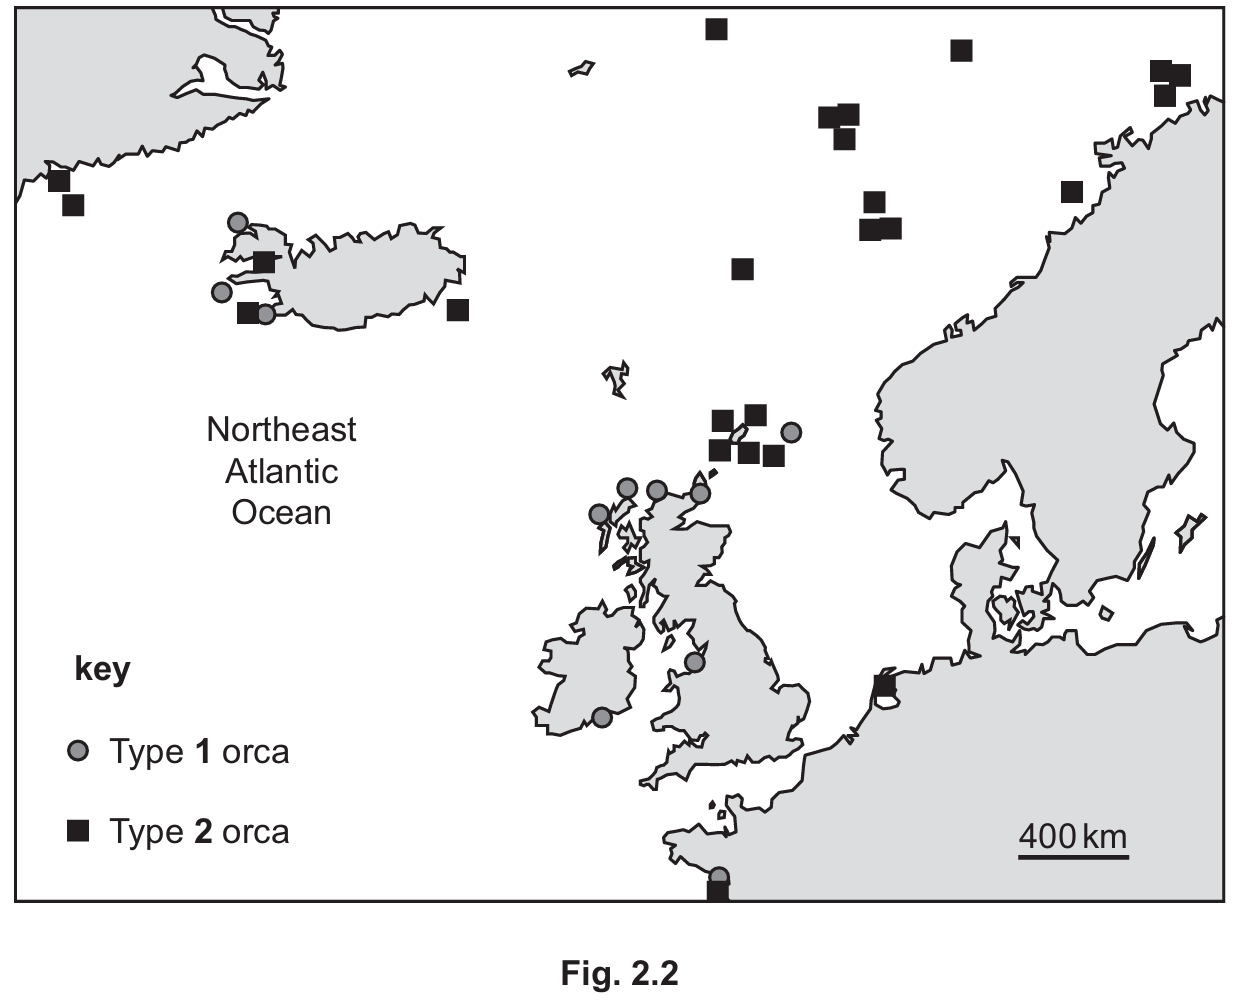
With reference to Fig. 2.2, explain why the type of speciation that is occurring in the orca is described as sympatric speciation.
(ii) Suggest examples of behavioural separation that would contribute to sympatric speciation of Type 1 orca and Type 2 orca.
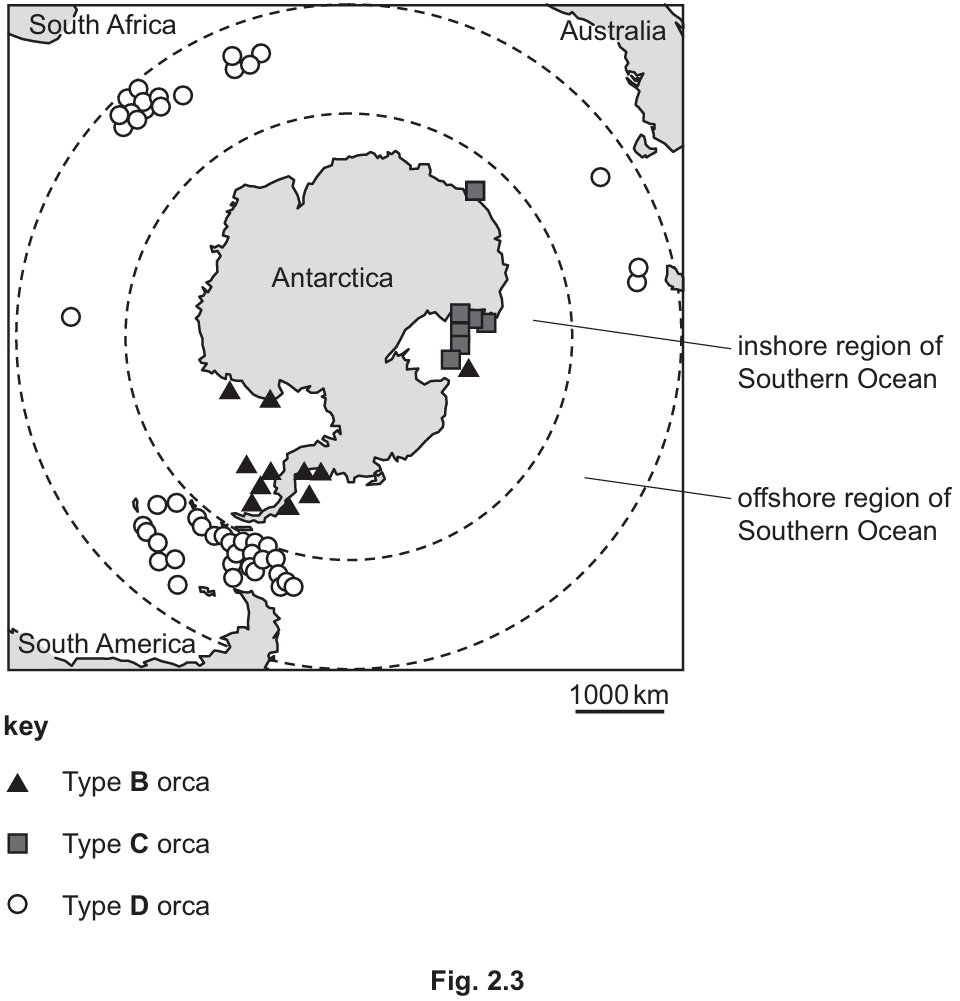
(b) In the Southern Ocean, which surrounds Antarctica, there are three distinct types of orca: Type B, Type C and Type D.
Fig. 2.3 shows the locations around Antarctica where Type B orca, Type C orca and Type D orca have been observed.
- Type B orca and Type C orca are mainly seen near the coastline of Antarctica (inshore).
- Type D orca are mainly seen in the Southern Ocean further away from the coastline of Antarctica (offshore).
There are phenotypic differences between the different types of orca. Fig. 2.4 shows a diagram of a Type B orca, a Type C orca and a Type D orca.
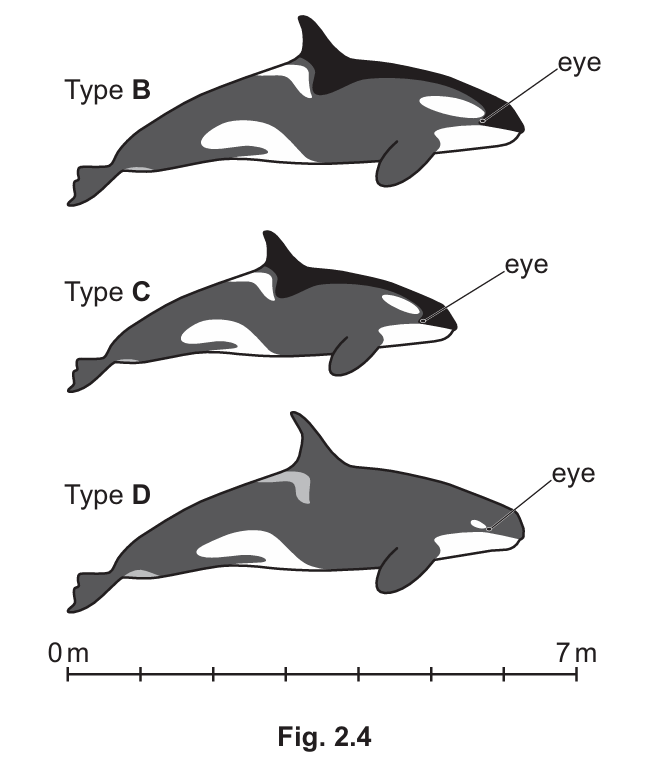
(i) With reference to Fig. 2.4, state one way in which the Type D orca is different from both the Type B orca and the Type C orca.
(ii) Phenotypic differences between Type D orca and the other types of orca shown in Fig. 2.4 could have resulted from the process of genetic drift, including the founder effect.
Suggest how genetic drift could result in phenotypic differences between Type D orca and the other types of orca shown in Fig. 2.4.
(c) In the future, the different types of orca may be classified as separate species. If so, some of these newly classified species will have very small population sizes.
Suggest two factors, other than population size, that should be monitored when assessing the conservation status of any newly classified species of orca.
▶️ Answer/Explanation
(a)(i) The speciation is described as sympatric because there is no geographical separation between Type 1 and Type 2 orcas – they are found in the same regions of the Northeast Atlantic Ocean but have developed different feeding habits and behaviors.
(a)(ii) Examples of behavioral separation that could contribute to sympatric speciation include:
- Different mating behaviors or courtship rituals between the types
- Different group sizes or social structures (e.g., Type 1 might form larger groups while Type 2 might be more solitary)
- Different hunting techniques or feeding times (e.g., Type 1 hunting fish during daylight while Type 2 hunts mammals at night)
- Different communication patterns or vocalizations that prevent interbreeding
(b)(i) One difference is that Type D orca has no black patch on the top of its body/back compared to Type B and C. Other possible differences include: smaller eyepatch, grey patch behind dorsal fin, taller dorsal fin, or more rounded head shape.
(b)(ii) Genetic drift could lead to phenotypic differences through:
- Isolation of a small population of orcas that migrated to a new area
- Limited genetic diversity in the founding population
- Random changes in allele frequencies due to the small population size
- Loss of certain alleles through chance events
- Accumulation of different mutations in the isolated population
Over time, these genetic changes could lead to visible physical differences in Type D orcas compared to other types.
(c) Two important factors to monitor would be:
- Habitat quality and threats (e.g., pollution, human disturbance)
- Genetic diversity within the population
- Reproductive rates and success
- Availability of prey/food sources
- Migration patterns and range
- Threats from human activities (e.g., fishing, shipping)
These factors would help assess the long-term viability of the newly classified species.
Gentamicin is an antibiotic used to treat severe bacterial infections in children.
(a) Some children have a genetic mutation in the gene MT-RNR1. If gentamicin is given to children with this genetic mutation, it can cause deafness.
Before gentamicin can be given to a child with a severe bacterial infection, PCR (polymerase chain reaction) and electrophoresis are used to test whether the child has this mutation. If the mutation is found, a different antibiotic must be given.
(i) Describe and explain the role of Taq polymerase in PCR.
(ii) PCR with primers specific to the MT-RNR1 gene is used to amplify DNA from the child that is being tested.
The PCR primers are designed so that the amplified product of the normal allele of MT-RNR1 is longer than the amplified product of the mutant allele.
Gel electrophoresis is used to separate the PCR products.
Fig. 3.1 shows the results of gel electrophoresis after using this method of PCR on DNA samples collected from three children.
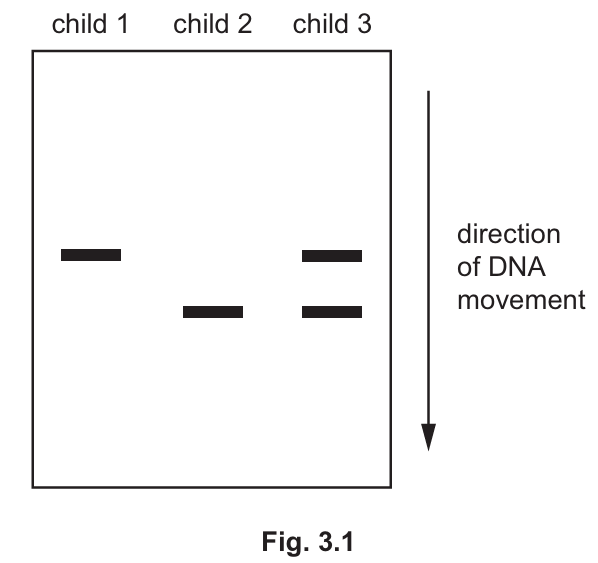
State which of the children in Fig. 3.1 cannot receive the antibiotic gentamicin to treat a severe bacterial infection.
(iii) Explain how gel electrophoresis produces the pattern of results shown in Fig. 3.1 from the PCR products of the MT-RNR1 gene.
(b) Some bacteria have plasmids that contain a gene conferring resistance to gentamicin. The gene can be transferred to other bacteria.
Suggest how the gentamicin-resistance gene can be transferred to other bacteria.
▶️ Answer/Explanation
(a)(i) Taq polymerase is a thermostable DNA polymerase enzyme that synthesizes new complementary DNA strands during PCR. Its key roles are:
- It binds to primers that are annealed to the target DNA sequence
- It adds nucleotides to the 3′ end of the primers to extend the new DNA strand
- It is heat-stable (thermostable), allowing it to withstand the high temperatures (95°C) used in PCR denaturation steps without denaturing
- Its optimum working temperature is about 72°C during the extension phase
- It forms phosphodiester bonds between adjacent nucleotides
(a)(ii) (child) 2 and (child) 3 cannot receive gentamicin as they show the band pattern indicating presence of the mutant allele.
(a)(iii) Gel electrophoresis separates DNA fragments based on size:
- DNA fragments are negatively charged due to phosphate groups
- When electric current is applied, DNA migrates toward the positive electrode (anode)
- Smaller fragments move faster through the gel matrix than larger ones
- The normal allele produces a longer PCR product that doesn’t travel as far
- The mutant allele produces a shorter PCR product that travels further
- The band positions reveal which children have the mutation (shorter band = mutant allele)
(b) The gentamicin-resistance gene can be transferred to other bacteria through:
- Horizontal gene transfer via conjugation (direct transfer through a pilus)
- Transformation (uptake of naked DNA from the environment)
- Transduction (transfer via bacteriophages)
- Plasmid transfer between bacteria
The HFE gene codes for the HFE protein, which has a role in the regulation of iron absorption by the body. Iron is an essential mineral that can be obtained only from the diet.
A mutation of the HFE gene known as C282Y causes hereditary haemochromatosis, which is an autosomal recessive disease. The mutant allele codes for a non-functioning protein. People who are homozygous for the mutant allele produce no functioning HFE protein and this results in an excess of iron being absorbed by the body. The accumulation (build-up) of iron in body organs over many years can cause organ damage.
People that are heterozygous for the HFE gene do not have hereditary haemochromatosis. They do absorb more iron from their diet than people who do not have the mutation, but this does not usually have any health effects.
(a) Construct a genetic diagram of a monohybrid cross to show how two parents who do not have hereditary haemochromatosis can produce a child with the disease.
Use the following symbols:
H = normal HFE allele
h = mutant HFE allele.
(b) Some scientists believe that the C282Y mutation may have first occurred in Ireland.
Scientists sequenced DNA obtained from two human fossil skeletons in Ireland. One of the fossils was 5200 years old and the other was 4000 years old.
The scientists concluded that:
- the human living 4000 years ago did have the C282Y mutation
- the human living 5200 years ago did not have the C282Y mutation.
Explain how analysis of the results of these DNA sequencing studies could have been carried out to allow the scientists to make these conclusions.
(c) At about the same time as the C282Y allele is thought to have first occurred in Ireland, the lifestyle of people in Europe began to change from hunter-gatherers to farmers.
Hunter-gatherers ate mainly meat with some wild plant food. Their diets had high quantities of iron. Early farmers ate mainly plants with some meat. Their diets had lower quantities of iron and these quantities were often inadequate (not enough).
Fig. 4.1 is a map of Europe showing the percentage of people in different countries who now have one C282Y allele of the HFE gene.
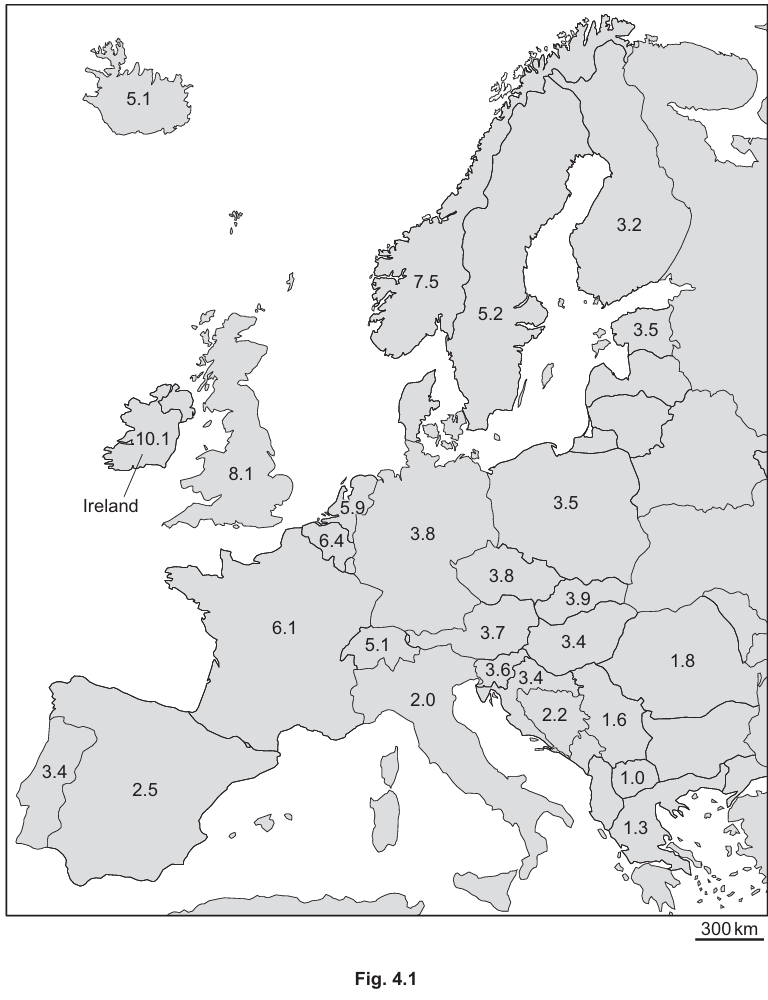
Fig. 4.1 shows that the C282Y allele does not occur only in Ireland and is now present throughout Europe. The C282Y allele has been maintained in European populations, even though it is a cause of hereditary haemochromatosis.
(i) Suggest how the C282Y allele of HFE has been maintained in European populations.
(ii) Suggest explanations for the differences in the percentage of people in different European countries who have one C282Y allele of the HFE gene, as shown in Fig. 4.1.
(d) Biological databases contain DNA sequence data from a large number of different people.
Table 4.1 shows three of these databases and the percentage of people in each database who have one C282Y allele of the HFE gene.
| database | percentage of people who have one C282Y allele of the HFE gene |
|---|---|
| database A | 2.6 |
| database B | 9.1 |
| database C | 6.3 |
Suggest one reason for the differences between the three databases shown in Table 4.1.
(e) In one population consisting of 2501 people, there were 9 people who were homozygous recessive for the HFE gene.
Use equation 1 and equation 2 of the Hardy–Weinberg principle to calculate the number of people in the population who are heterozygous for the HFE gene.
equation 1: \( p + q = 1 \)
equation 2: \( p^2 + 2pq + q^2 = 1 \)
key to symbols:
\( p = \) frequency of the dominant allele
\( q = \) frequency of the recessive allele
\( p^2 = \) frequency of homozygous dominant genotype
\( 2pq = \) frequency of heterozygous genotype
\( q^2 = \) frequency of homozygous recessive genotype
number of people who are heterozygous for the HFE gene = ……
▶️ Answer/Explanation
(a)
Parental genotypes: Hh × Hh (both heterozygous carriers)
Possible gametes: H or h from each parent
Offspring genotypes:
- 25% HH (normal)
- 50% Hh (carrier)
- 25% hh (affected with haemochromatosis)

This shows how two unaffected carriers can produce an affected child.
(b)
The scientists would have:
- Extracted DNA from both fossil samples
- Used PCR to amplify the HFE gene region
- Sequenced the DNA to determine the nucleotide sequence
- Compared the sequences to the known C282Y mutation sequence
- The 4000-year-old sample would show the mutation while the 5200-year-old would not
(c)(i)
The C282Y allele has been maintained due to:
- Heterozygote advantage – carriers absorb more iron which was beneficial when dietary iron was limited during the agricultural transition
- Natural selection favored those who could absorb more iron from plant-based diets
- The allele frequency reached significant levels before negative selection against homozygotes became strong enough to eliminate it
- Genetic drift in small populations may have helped maintain the allele
(c)(ii)
Differences in allele frequency across Europe may be due to:
- Founder effects – higher frequencies in Ireland where it likely originated
- Migration patterns – frequencies decrease with distance from Ireland
- Different historical diets – regions with historically lower iron diets may have stronger selection for the allele
- Population bottlenecks – some populations may have experienced events that changed allele frequencies
(d)
Possible reasons for database differences:
- The databases contain data from different ethnic groups or regions with different allele frequencies
- They may represent different sample sizes (one might be much smaller)
- They could be from different time periods showing changing allele frequencies
(e)
Using Hardy-Weinberg:
1. Calculate \( q^2 = 9/2501 = 0.0036 \)
2. Therefore \( q = \sqrt{0.0036} = 0.06 \)
3. Then \( p = 1 – q = 0.94 \)
4. Heterozygote frequency \( 2pq = 2 × 0.94 × 0.06 = 0.1128 \)
5. Number of heterozygotes = 0.1128 × 2501 ≈ 282
Final answer: 282
Fig. 5.1 shows a photomicrograph of a single plant cell in a stage of meiosis.
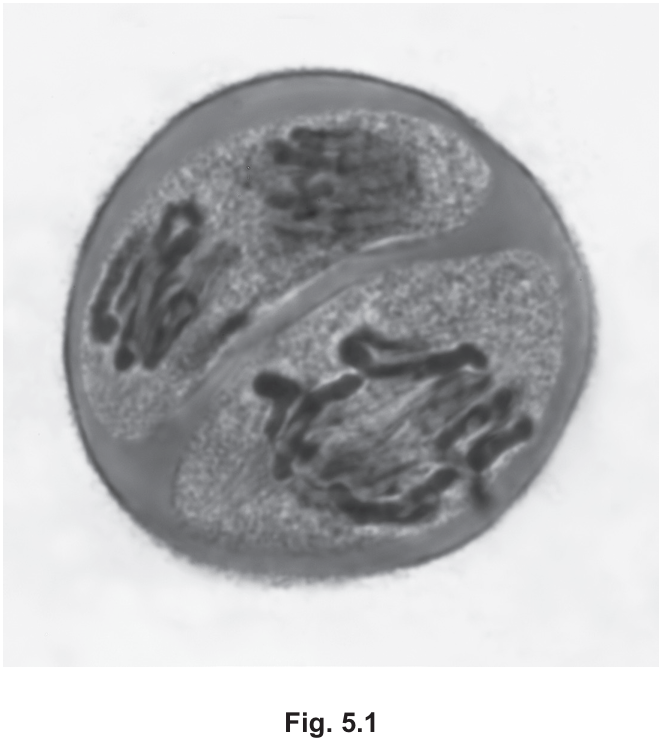
Describe the stage of meiosis shown in Fig. 5.1.
▶️ Answer/Explanation
The cell shown in Fig. 5.1 is in anaphase II of meiosis. This can be identified by several key features:
- There are two distinct groups of chromosomes visible, each being pulled toward opposite poles of the cell.
- The chromosomes appear as single chromatids (individual chromosomes) rather than paired chromatids, indicating this is meiosis II rather than meiosis I.
- The spindle fibers are clearly attached to the chromosomes at their kinetochores, pulling them apart.
- The cell is elongated, showing the dynamic movement of chromosomes toward the poles.
- There is no nuclear envelope present at this stage.
Additional details that could be included:
- The centromeres lead the movement with chromosome arms trailing behind.
- The spindle fibers are shortening as they pull the chromosomes.
- This stage follows metaphase II where chromosomes were aligned at the equatorial plate.
- The separation of sister chromatids ensures each resulting gamete will have half the original chromosome number.
This stage is crucial for ensuring proper chromosome segregation and the production of genetically diverse gametes with the haploid number of chromosomes.
Topic – Homeostasis and Control Mechanisms
(a) Fig. 6.1 outlines part of the control mechanism that regulates blood glucose concentration.
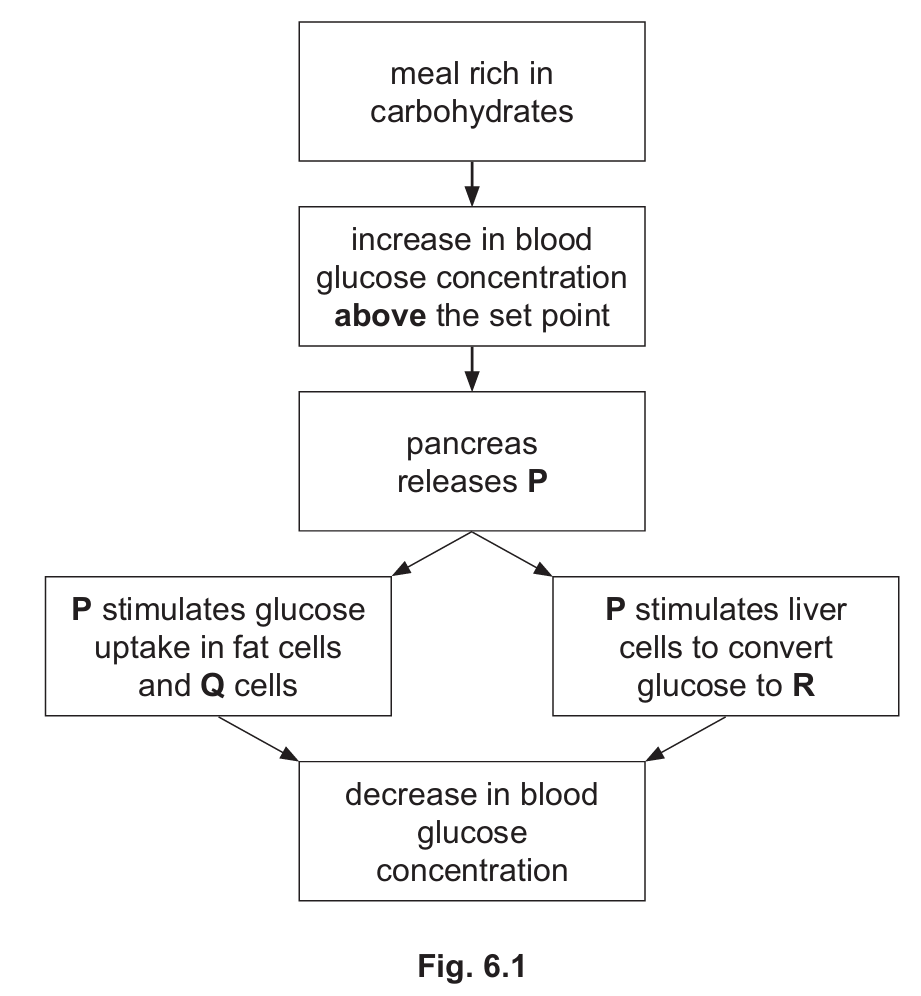
(i) Identify P, Q and R.
(ii) State the type of homeostatic control mechanism operating in Fig. 6.1.
(b) When the blood glucose concentration decreases below the set point, a hormone is released from the pancreas.
Describe how the release of this hormone leads to the blood glucose concentration returning to the set point.
▶️ Answer/Explanation
(a)(i)
P – insulin
Q – muscle or liver
R – glycogen
Detailed Solution:
The diagram shows the process that occurs when blood glucose levels rise after a carbohydrate-rich meal. P is the hormone insulin, which is released by the pancreas in response to high blood glucose. Q represents the target cells that take up glucose – primarily muscle and liver cells. R is the storage form of glucose, glycogen, which is synthesized in liver and muscle cells when glucose levels are high.
(a)(ii)
Negative feedback
Detailed Solution:
The mechanism shown is negative feedback because the response (insulin release and subsequent glucose uptake) opposes the original stimulus (high blood glucose), bringing the system back to its set point. This is a classic example of how homeostasis maintains stable internal conditions.
(b)
1. Glucagon is released by pancreatic α-cells
2. Binds to receptors on liver cell membranes
3. Activates G-proteins
4. Activates adenyl cyclase
5. Converts ATP to cAMP (second messenger)
6. Triggers enzyme cascade
7. Activates enzymes via phosphorylation
8. Glycogenolysis occurs (glycogen → glucose)
9. Gluconeogenesis may also occur
10. Glucose is released into bloodstream
Detailed Solution:
When blood glucose drops below the set point, the pancreas releases glucagon. This hormone initiates a complex signaling cascade in liver cells. The process begins with glucagon binding to its receptor, which activates G-proteins. These then stimulate adenyl cyclase to convert ATP to cyclic AMP (cAMP), a second messenger that amplifies the signal. The cAMP activates protein kinases through phosphorylation, leading to the activation of glycogen phosphorylase. This enzyme breaks down glycogen into glucose-1-phosphate, which is converted to glucose-6-phosphate and then to free glucose. The liver releases this glucose into the bloodstream, raising blood glucose levels back to normal. Additionally, glucagon may stimulate gluconeogenesis – the synthesis of new glucose from non-carbohydrate sources like amino acids. This entire process is another example of negative feedback, as the response (increased blood glucose) counteracts the original stimulus (low blood glucose).
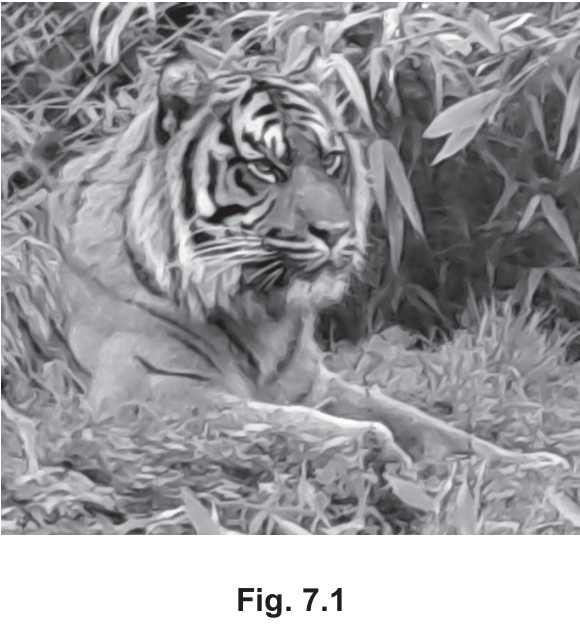
The Sumatran tiger, Panthera tigris sumatrae, is classified as critically endangered on the International Union for Conservation of Nature (IUCN) Red List of Threatened SpeciesTM.
Fig. 7.1 shows a Sumatran tiger.
(a) Fig. 7.2 shows the number of wild Sumatran tigers in the world between 1970 and 2020.
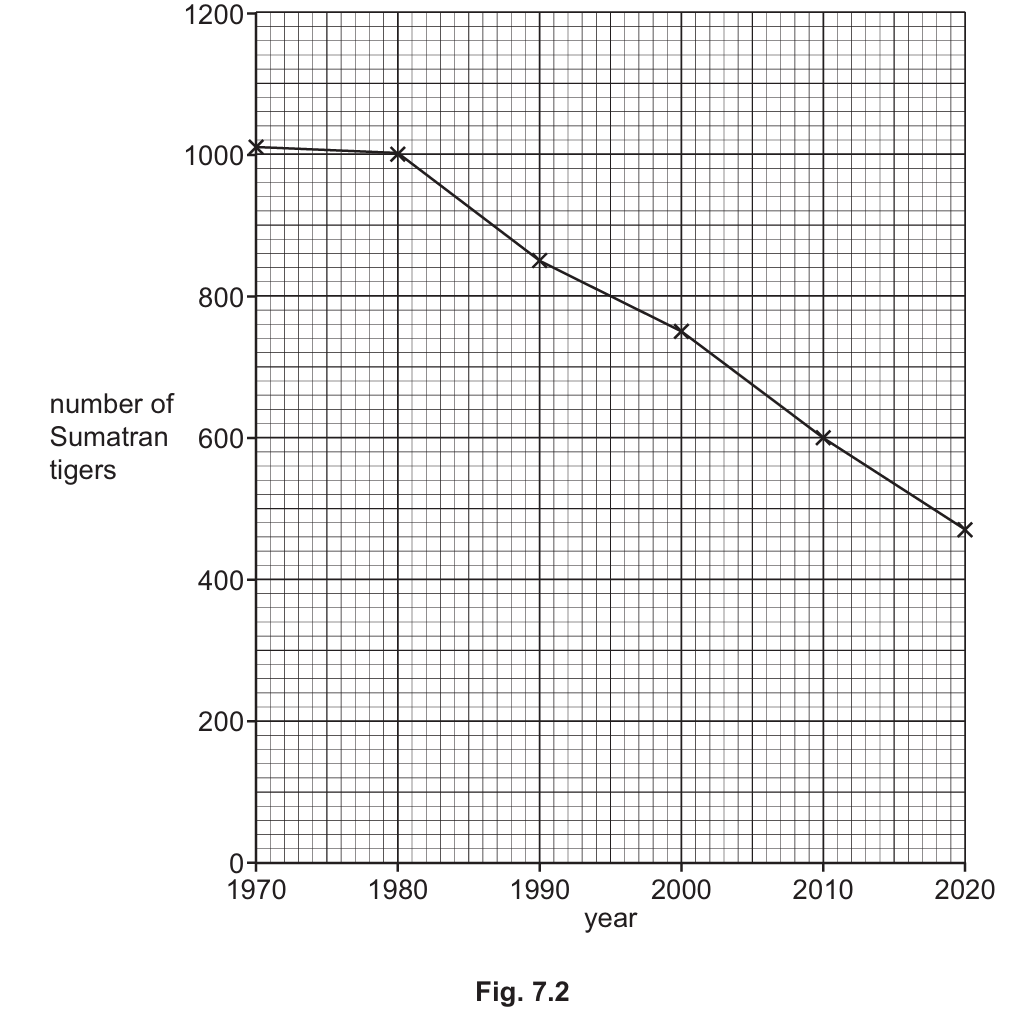
(i) Calculate the mean rate of decrease in the Sumatran tiger population between 1970 and 2020.
(ii) There are a number of different ways to help conserve Sumatran tigers. For example, some zoos have captive breeding programmes.
Outline ways in which Sumatran tigers may be conserved, other than captive breeding programmes.
(b) Outline reasons for maintaining animal biodiversity.
(c) Captive breeding programmes sometimes use IVF.
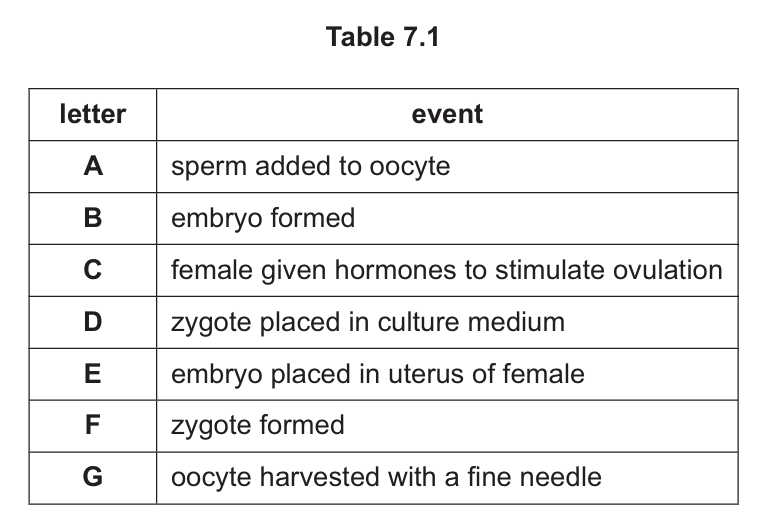
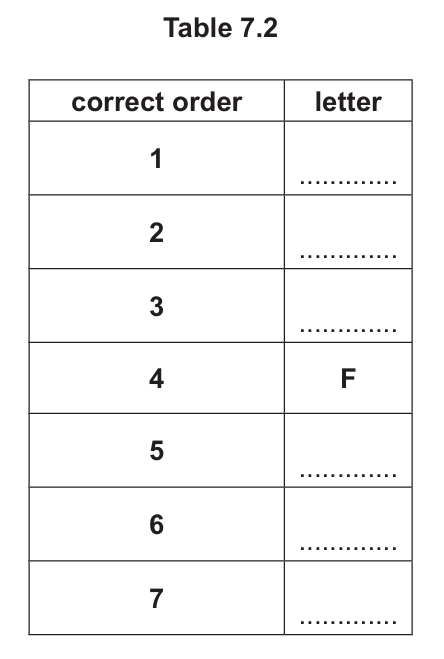
Table 7.1 shows some of the events that occur during an IVF procedure. They are not listed in the correct order.
Complete Table 7.2 to show the correct order of the events. One of the events has already been added in the correct position.
▶️ Answer/Explanation
(a)(i) 10.8 tigers per year
To calculate the mean rate of decrease: First find the total decrease (1010 tigers in 1970 – 470 tigers in 2020 = 540 tigers decrease). Then divide by the number of years (2020 – 1970 = 50 years). 540 ÷ 50 = 10.8 tigers per year.
(a)(ii) Possible conservation methods include:
- Banning hunting, poaching, and trade of tigers and tiger products
- Enforcing strict penalties for violations
- Establishing national parks and protected reserves
- Using tracking devices to monitor tiger populations
- Raising public awareness through education programs
- Providing veterinary care for wild populations
(b) Reasons for maintaining biodiversity include:
- Preserving genetic diversity for future adaptations
- Supporting ecotourism and local economies
- Ethical responsibility to protect species
- Maintaining ecosystem balance and food webs
- Aesthetic value of diverse wildlife
- Scientific research opportunities
- Cultural significance of certain species
- Keystone species that support entire ecosystems
(c) Correct order of IVF events:
- C – Female given hormones to stimulate ovulation
- G – Oocyte harvested with a fine needle
- A – Sperm added to oocyte
- F – Zygote formed
- D – Zygote placed in culture medium
- B – Embryo formed
- E – Embryo placed in uterus of female
The process begins with hormone stimulation (C), followed by egg collection (G). The eggs are then fertilized with sperm (A) to form zygotes (F). The zygotes develop in culture (D) into embryos (B), which are then transferred to the uterus (E).
(a) In the link reaction, a two-carbon acetyl group is produced from pyruvate. The acetyl group is transferred to coenzyme A to form acetyl coenzyme A (acetyl-coA).
State the terms used to summarise the two chemical changes that occur in the link reaction to produce an acetyl group from pyruvate.
(b) Acetyl-coA combines with oxaloacetate in the Krebs cycle to form citrate. This reaction is catalysed by the enzyme citrate synthase.
Acetyl-coA has a similar shape to succinyl-coA, one of the compounds made in a later part of the Krebs cycle.
An experiment was carried out to investigate the effect of increasing the concentration of acetyl-coA on the activity of citrate synthase. The experiment was repeated, this time adding a solution of succinyl-coA.
Fig. 8.1 shows the results of these experiments.
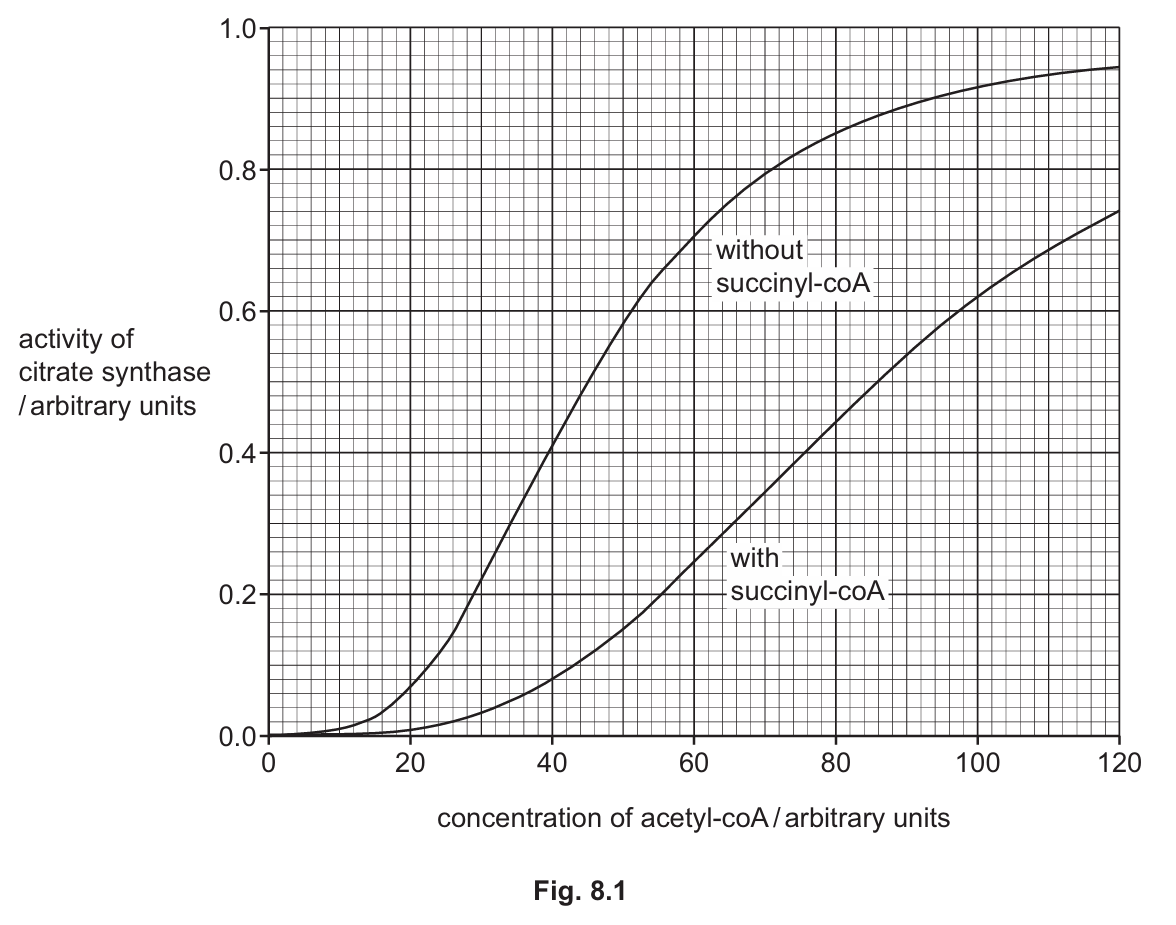
With reference to Fig. 8.1, explain how succinyl-coA could help to regulate the Krebs cycle.
(c) The coenzyme NAD plays an important role in respiration.
Describe the role of NAD in the stages of aerobic respiration that occur in a mitochondrion.
▶️ Answer/Explanation
(a) decarboxylation; dehydrogenation/oxidation
Detailed Solution:
In the link reaction, pyruvate undergoes two main chemical changes:
- Decarboxylation: Removal of a carboxyl group (CO₂) from pyruvate, converting the 3-carbon pyruvate to a 2-carbon acetyl group.
- Dehydrogenation/Oxidation: Removal of hydrogen atoms (oxidation) from pyruvate, with the hydrogen atoms being accepted by NAD to form reduced NAD (NADH).
(b) Any four from:
- Reduces activity of citrate synthase or activity of citrate synthase is higher without succinyl-coA than with succinyl-coA
- Comparative data quote (e.g., at 40 arbitrary units of acetyl-coA, activity is about 0.8 without succinyl-coA vs 0.4 with succinyl-coA)
- Succinyl-coA binds to citrate synthase active site
- Succinyl-coA acts as a competitive inhibitor (due to similar shape to acetyl-coA)
- Slows down Krebs cycle when there’s sufficient succinyl-coA
- Prevents build up/reduces production of citrate/intermediates
Detailed Solution:
The graph shows that when succinyl-coA is present, the activity of citrate synthase is reduced at all concentrations of acetyl-coA. This is because:
- Succinyl-coA, being structurally similar to acetyl-coA, can bind to the active site of citrate synthase, acting as a competitive inhibitor.
- This inhibition creates a negative feedback mechanism – when there’s sufficient succinyl-coA (a later product in the Krebs cycle), the cycle slows down.
- This prevents excessive accumulation of intermediates and helps regulate the rate of the Krebs cycle according to cellular energy needs.
(c) Any four from:
- Hydrogen carrier/reduced
- In link reaction/Krebs cycle
- Moves to inner mitochondrial membrane/cristae
- Releases hydrogen (atoms)/protons and electrons
- For use in oxidative phosphorylation
- NAD oxidized/recycled
Detailed Solution:
NAD plays crucial roles in mitochondrial respiration:
- In the link reaction, NAD accepts hydrogen atoms from pyruvate, becoming reduced NAD (NADH).
- In the Krebs cycle, NAD is reduced to NADH at multiple steps (isocitrate → α-ketoglutarate, α-ketoglutarate → succinyl-CoA, malate → oxaloacetate).
- The reduced NADH carries these high-energy electrons to the electron transport chain on the inner mitochondrial membrane.
- At the electron transport chain, NADH is oxidized back to NAD⁺, releasing protons and electrons that drive ATP synthesis through oxidative phosphorylation.
- This recycling of NAD⁺ allows it to continue participating in dehydrogenase reactions throughout respiration.
The chloroplasts of leaves of tobacco plants, Nicotiana sp., contain chlorophyll a and chlorophyll b.
(a) Describe the role of chlorophyll b in photosynthesis.
(b) A mutant tobacco plant was found to contain more chlorophyll b than normal tobacco plants.
An investigation was carried out to measure the rate of photosynthesis of normal and mutant tobacco plants at increasing light intensities. The rate of production of oxygen was used as a measure of the rate of photosynthesis.
Other variables were kept constant.
Fig. 9.1 shows the results of this investigation.
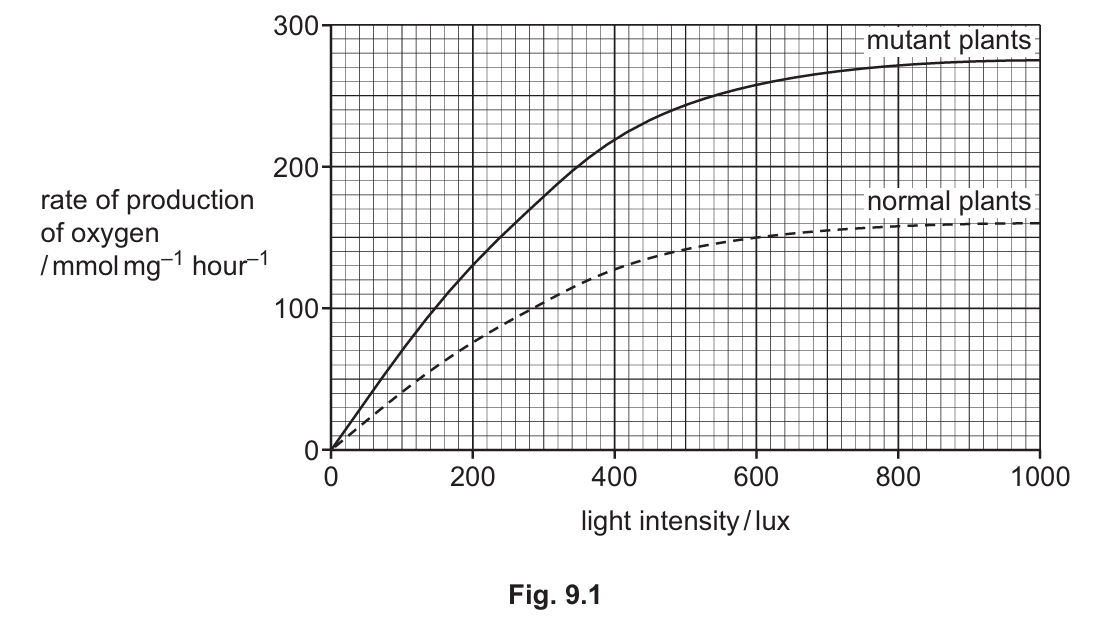
(b)(i) Describe the results shown in Fig. 9.1.
(b)(ii) It was observed that the mutant tobacco plants had a faster growth rate than the normal tobacco plants.
Suggest explanations for this observation.
▶️ Answer/Explanation
(a) Chlorophyll b acts as an accessory pigment in photosynthesis. Its main roles are:
- It absorbs light wavelengths (particularly in the blue and red-orange parts of the spectrum) that chlorophyll a doesn’t absorb as efficiently
- It transfers the absorbed light energy to chlorophyll a in the reaction center
- This extends the range of wavelengths that can be used for photosynthesis
- It increases the overall efficiency of the light-dependent reactions
(b)(i) The results show:
- For both normal and mutant plants, the rate of photosynthesis (oxygen production) increases with light intensity up to a certain point, then levels off
- The mutant plants consistently show higher rates of photosynthesis than normal plants at all light intensities
- The light saturation point (where rate levels off) may be higher for mutant plants
- The maximum rate of photosynthesis is greater in mutant plants
(b)(ii) The faster growth rate of mutant plants can be explained by:
- Increased chlorophyll b allows more light absorption, leading to higher rates of photosynthesis
- More ATP and NADPH are produced in the light-dependent reactions
- This enables more carbon fixation in the Calvin cycle
- More triose phosphates are produced, which can be used to make glucose and other organic compounds
- More organic compounds provide more building blocks and energy for growth
- The plants can synthesize more structural materials (cellulose, proteins, etc.) for growth
- More energy (ATP) is available for active processes like cell division and expansion
The increased chlorophyll b content gives the mutant plants a competitive advantage in terms of light capture and energy production, directly translating to faster growth rates under the same environmental conditions.
(a) Fig. 10.1 shows chemoreceptor cells in a taste bud. Two of the chemoreceptor cells have formed synapses with sensory neurone dendrites.
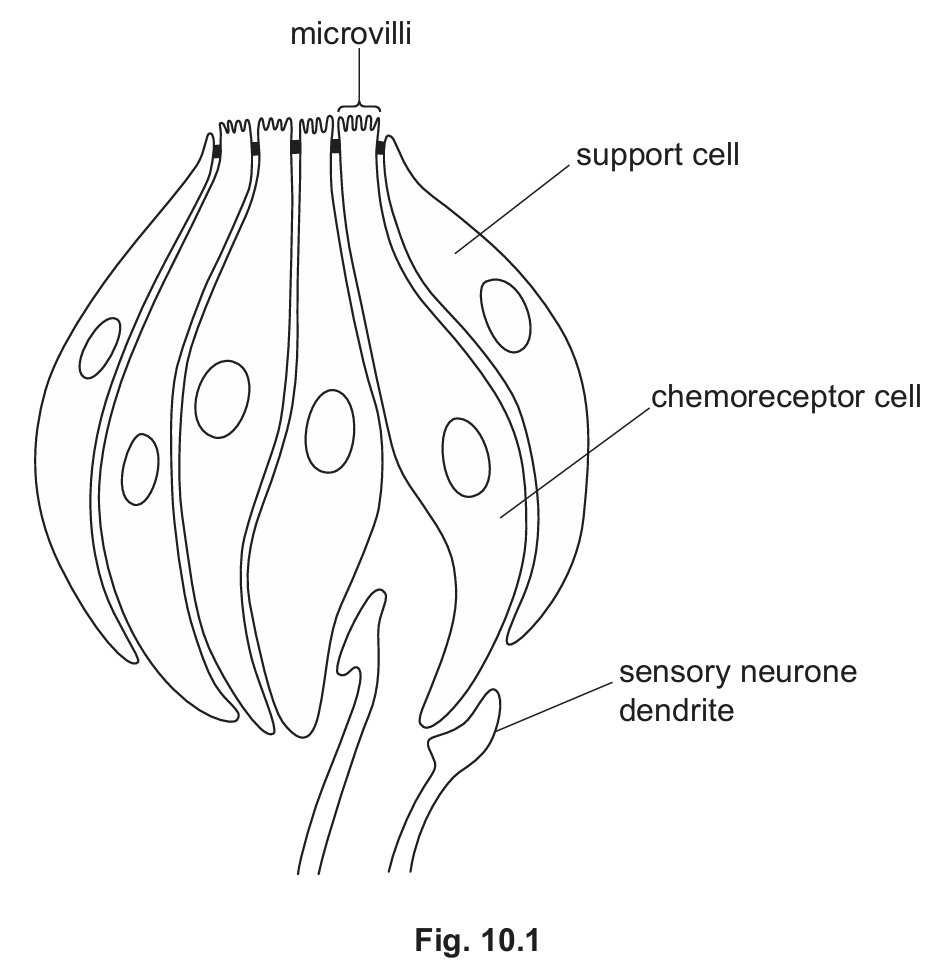
Describe how the contact of sodium ions with the microvilli of the chemoreceptor cell can lead to the release of a neurotransmitter by the cell.
(b) Some of the neurotransmitters in the brain are produced through a series of reactions (reaction pathway) from a chemical called DOPA.
DOPA is also involved in other reaction pathways. For example, in the skin and eyes, DOPA is part of a different reaction pathway that depends on the TYR gene.
Describe and explain the phenotypic consequences for the skin and eyes of a person who is homozygous for a mutated, non-functional allele of the TYR gene.
▶️ Answer/Explanation
(a) The process of neurotransmitter release in taste bud chemoreceptor cells when sodium ions contact the microvilli involves several steps:
- Sodium ions (Na⁺) enter the chemoreceptor cell through sodium channels in the microvilli via facilitated diffusion.
- The influx of Na⁺ causes depolarization of the cell membrane (makes it less negative inside).
- If sufficient depolarization occurs to reach the threshold potential, voltage-gated calcium channels open.
- Calcium ions (Ca²⁺) enter the cell, triggering the movement of neurotransmitter-containing vesicles toward the presynaptic membrane.
- The vesicles fuse with the membrane through exocytosis, releasing neurotransmitter molecules into the synaptic cleft.
- The neurotransmitter then binds to receptors on the sensory neuron dendrite, initiating a nerve impulse.
(b) For a person homozygous for a non-functional TYR allele:
- The TYR gene encodes the enzyme tyrosinase, which is crucial for melanin production.
- Without functional tyrosinase, the pathway converting tyrosine → DOPA → dopaquinone → melanin cannot proceed.
- This results in albinism – complete lack of melanin pigment in skin, hair, and eyes.
- Phenotypic consequences include:
- Very pale skin that burns easily in sunlight (no protective melanin)
- White or very light-colored hair
- Pinkish eyes due to visible blood vessels (no pigment in iris)
- Vision problems including photophobia (light sensitivity), nystagmus (involuntary eye movements), and reduced visual acuity due to abnormal development of retinal pathways
- The lack of eye pigment also causes abnormal routing of optic nerve fibers at the chiasm, further impairing vision.
This condition is called oculocutaneous albinism type 1 (OCA1), the most severe form of albinism, where both skin/hair and eyes are affected due to complete absence of tyrosinase activity.