▶️ Answer/Explanation
(a)
1. Total plants = 660 (purple) + 440 (red) = 1100
2. Red flowers are recessive (q2): q2 = 440/1100 = 0.4
3. q = √0.4 = 0.632
4. p = 1 – q = 1 – 0.632 = 0.368
5. Heterozygous frequency (2pq) = 2 × 0.632 × 0.368 = 0.465
6. Number of heterozygous plants = 0.465 × 1100 = 511.5 ≈ 512
Final answer: 511/512
Explanation: Using the Hardy-Weinberg principle, we first calculate the allele frequencies. The recessive phenotype (red flowers) gives us q2, from which we find q. Then p is calculated as 1-q. The heterozygous frequency is 2pq, which when multiplied by the total population gives the number of heterozygous plants.
(b)
1. The flower colors form a continuous range with many intermediate shades rather than distinct categories.
2. The phenotype is controlled by multiple genes (at least four), which typically results in continuous variation.
3. The phenotype is influenced by environmental factors (CO2 concentration and time of day).
Explanation: Continuous variation typically shows these characteristics: a range of phenotypes without clear categories, polygenic inheritance, and environmental influence on the phenotype.
(c)(i)
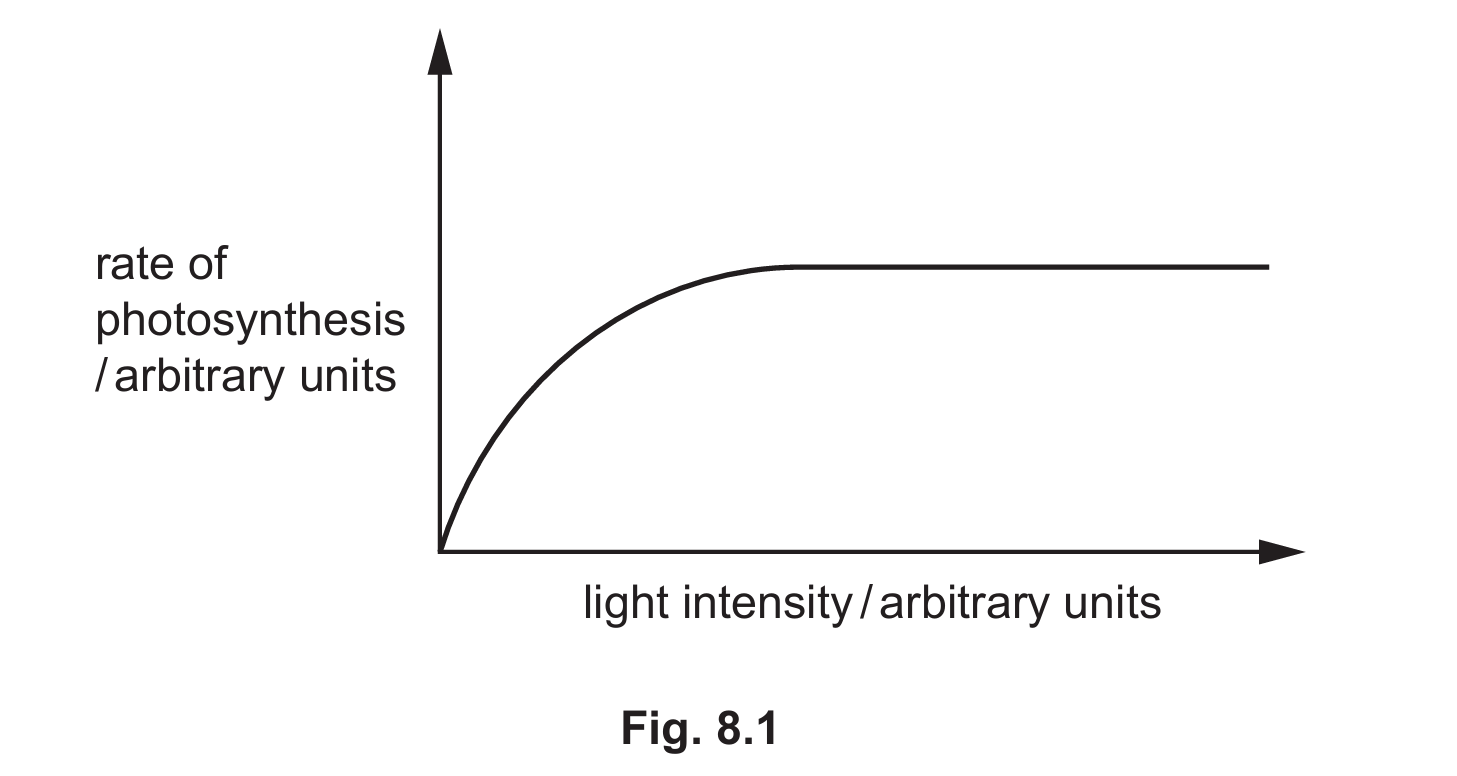
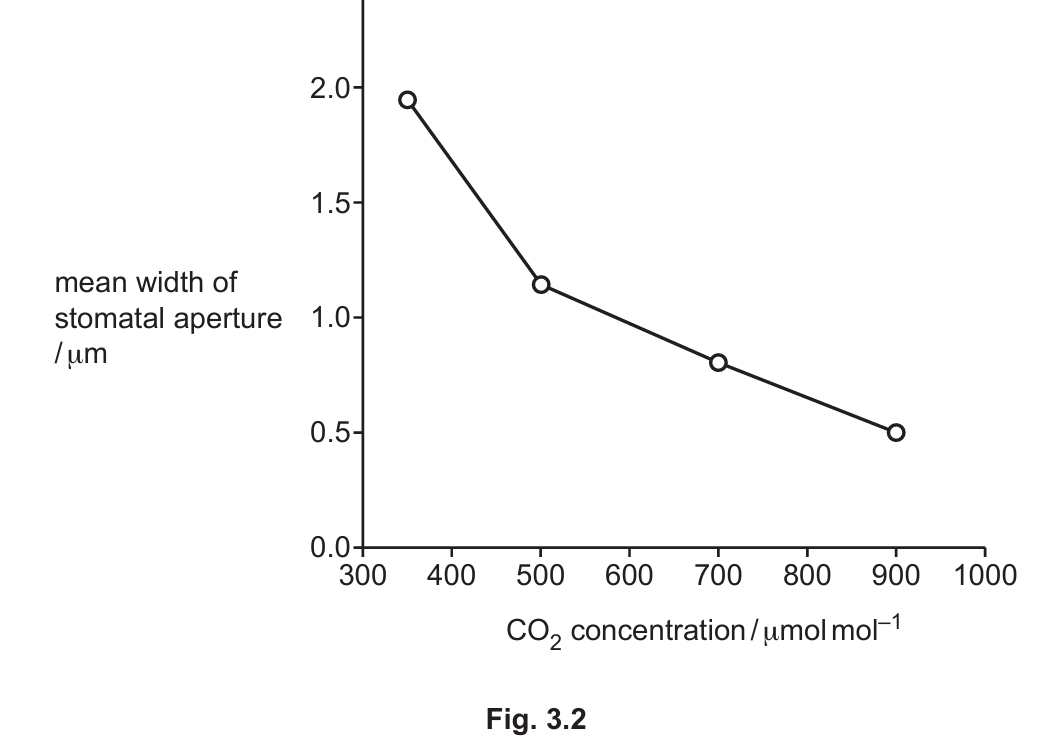
1. As CO2 concentration increases, stomatal apertures decrease (as shown in Fig. 3.2).
2. This reduces water loss through transpiration when water availability is low.
3. The plant can therefore conserve water while still obtaining sufficient CO2 for photosynthesis.
Explanation: The graph shows an inverse relationship between CO2 concentration and stomatal aperture. This adaptive response helps plants survive in drier conditions by reducing water loss while maintaining photosynthesis.
(c)(ii)
1. Abscisic acid (ABA) binds to receptors on guard cell membranes.
2. This triggers calcium ions (Ca2+) to enter the cytoplasm, acting as secondary messengers.
3. Potassium ions (K+) leave the guard cells.
4. Water follows by osmosis, moving out of the guard cells.
5. The guard cells become flaccid, closing the stomatal pore.
Explanation: ABA is a stress hormone that helps plants conserve water during drought conditions. The ion movements change the water potential in guard cells, leading to water loss and stomatal closure.
(d)(i)
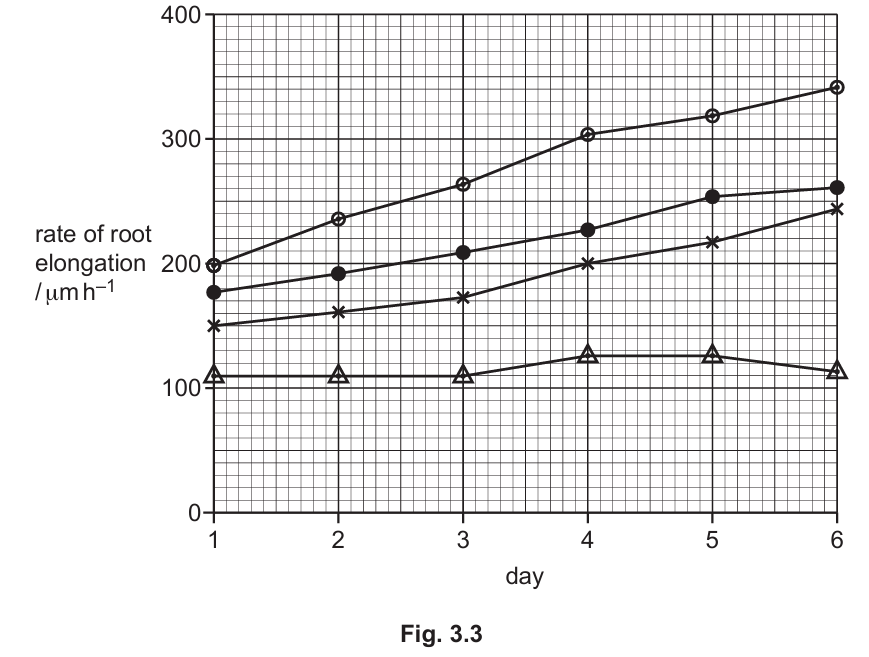
1. At 0.1 μmol concentration, abscisic acid slightly increases the rate of root elongation compared to the control.
2. At higher concentrations (1.0 μmol and 10.0 μmol), abscisic acid decreases the rate of root elongation.
3. The 10.0 μmol treatment shows the most significant inhibition, with the rate remaining nearly constant over the six days.
Explanation: The graph shows a hormetic response – low concentrations stimulate growth while higher concentrations inhibit it. This suggests ABA has concentration-dependent effects on root growth.
(d)(ii)
1. The binding of auxin to receptors causes protons/H+ ions to be pumped into cell walls.
2. This activates proteins called expansins, which disrupt the links between cellulose microfibrils. The cell walls are then able to expand.
Explanation: Auxin promotes cell elongation through the acid growth hypothesis. Proton pumps acidify the cell wall, activating expansins that loosen the cellulose network, allowing turgor pressure to expand the cell.
▶️ Answer/Explanation
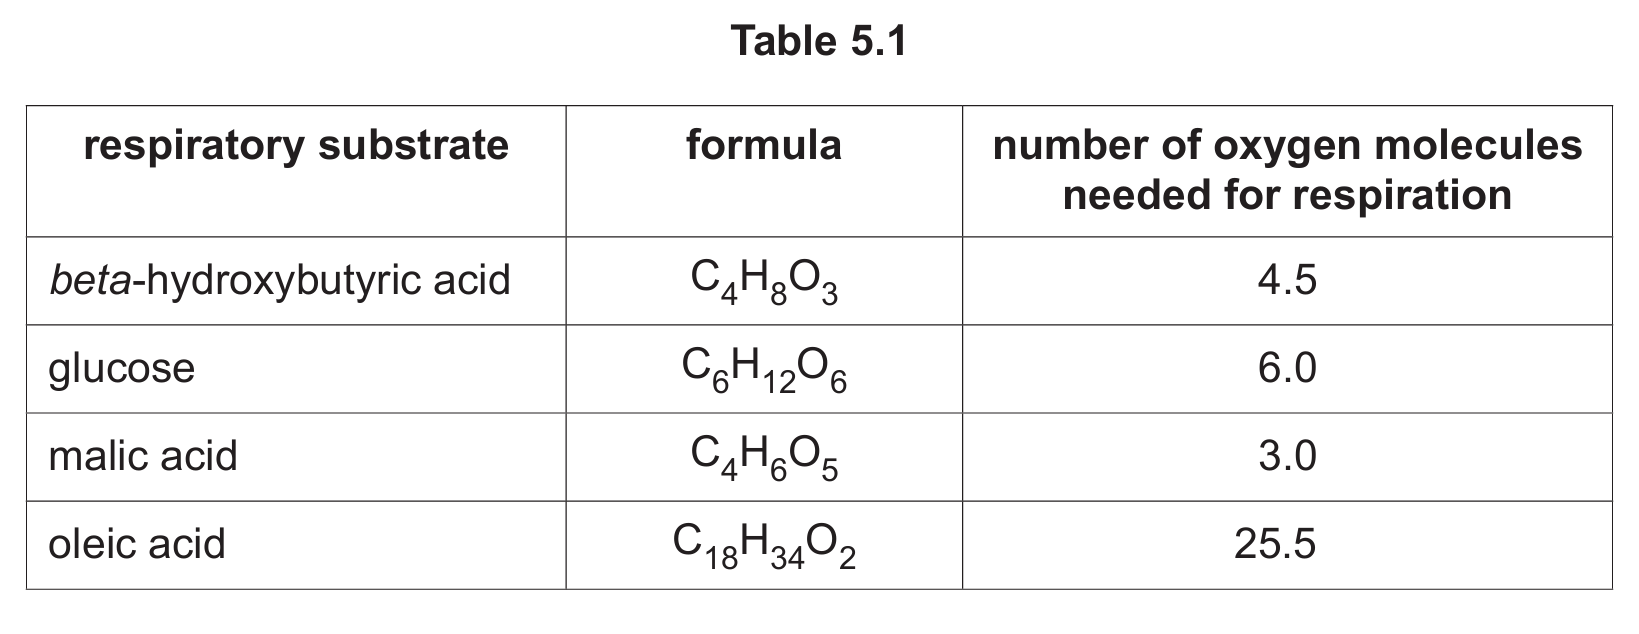
(a)
respiratory substrate with the highest RQ: malic acid
respiratory substrate with the lowest RQ: oleic acid
Explanation:
The respiratory quotient (RQ) is calculated as the ratio of CO2 produced to O2 consumed during respiration. For complete oxidation:
1. Malic acid (C4H6O5) requires 3 O2 molecules and produces 4 CO2 molecules, giving RQ = 4/3 ≈ 1.33 (highest).
2. Oleic acid (C18H34O2) is a fatty acid requiring 25.5 O2 molecules and producing 18 CO2 molecules, giving RQ = 18/25.5 ≈ 0.7 (lowest).
3. Glucose (C6H12O6) has RQ = 1 (balanced equation).
4. Beta-hydroxybutyric acid (C4H8O3) is a ketone body with RQ ≈ 0.89.
(b)
Similarities:
- Both processes use pyruvate from glycolysis as the starting molecule
- Both occur in the cytoplasm/cytosol of cells
- Both regenerate NAD+ from NADH to allow glycolysis to continue
- Both involve redox reactions (oxidation of NADH and reduction of organic molecules)
Differences:
- End products: Mammals produce lactate (lactic acid) while yeast produces ethanol and CO2
- Steps: Mammalian fermentation is a single-step reduction of pyruvate to lactate, while yeast fermentation has two steps (pyruvate → acetaldehyde → ethanol)
- Gas production: Yeast releases CO2 as a byproduct, while mammalian fermentation doesn’t produce gas
- Reversibility: Lactate fermentation is reversible (lactate can be converted back to pyruvate), while ethanol fermentation is irreversible
- Enzymes: Different enzymes are involved – lactate dehydrogenase in mammals vs pyruvate decarboxylase and alcohol dehydrogenase in yeast
Explanation:
Fermentation pathways diverge after glycolysis based on the organism’s enzymatic capabilities. Mammals convert pyruvate to lactate to regenerate NAD+ quickly during oxygen debt (e.g., intense exercise). Yeast, being fungi, have evolved the ability to decarboxylate pyruvate to acetaldehyde and then reduce it to ethanol, which is less toxic to their cells than lactate would be. The CO2 production in yeast fermentation is economically important in baking and brewing industries.
▶️ Answer/Explanation
(a)(i) Similarities between neuromuscular junction and cholinergic synapse:
1. Both contain vesicles of acetylcholine which are released into the synaptic cleft.
2. Both have numerous mitochondria to provide ATP for neurotransmitter release.
3. Both have distinct presynaptic and postsynaptic membranes separated by a synaptic cleft.
4. Both have receptors for acetylcholine on the postsynaptic membrane.
5. Both involve calcium ion entry into the presynaptic terminal to trigger neurotransmitter release.
6. Both involve sodium ion channels opening in the postsynaptic membrane during depolarization.
Explanation: The neuromuscular junction is essentially a specialized type of cholinergic synapse between a motor neuron and muscle fiber. They share the same basic structure and mechanism of signal transmission using acetylcholine as the neurotransmitter.
(a)(ii) Why calcium phosphate formation reduces power strokes:
1. Formation of calcium phosphate reduces the number of free calcium ions available in the sarcoplasmic reticulum.
2. Fewer calcium ions are released into the sarcoplasm during muscle stimulation.
3. Reduced calcium means less binding to troponin molecules on the actin filaments.
4. Without sufficient calcium-troponin binding, tropomyosin doesn’t move enough to expose myosin binding sites on actin.
5. Fewer actin-myosin cross bridges can form, resulting in fewer power strokes.
6. Additionally, the trapped phosphate ions are unavailable for ATP regeneration, further limiting muscle contraction.
Explanation: Calcium ions are crucial for initiating the contraction cycle by binding to troponin. When they become sequestered as calcium phosphate, this essential trigger is diminished, directly reducing the number of power strokes that can occur in the sarcomeres.
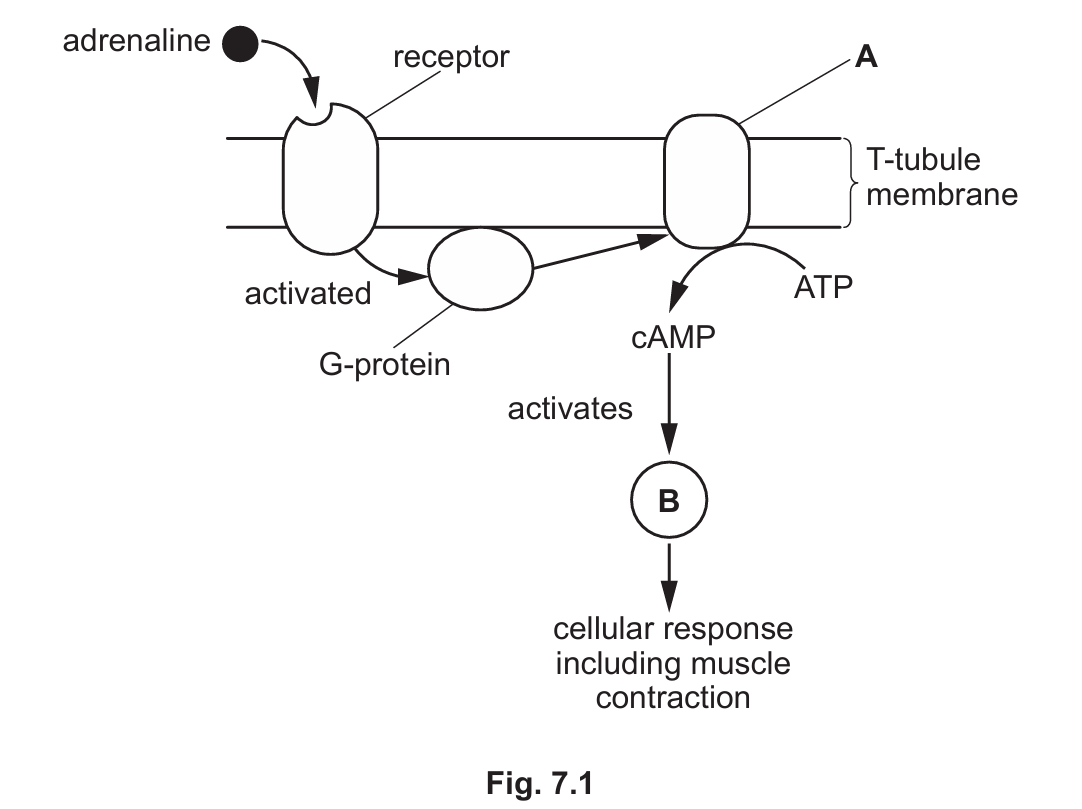
(b) Identification of molecules A and B:
A: Adenylyl cyclase
B: Protein kinase A
Explanation: In the adrenaline signaling pathway shown in Fig. 7.1, the activated G-protein stimulates adenylyl cyclase (A) to convert ATP to cAMP. The cAMP then activates protein kinase A (B), which phosphorylates various target proteins to produce the cellular response, including enhanced muscle contraction. This is the same basic pathway used by glucagon in liver cells.