
Topic: 14.1
(a) Fig. 1.1 is a diagram of part of a Bowman’s capsule and a glomerular capillary.
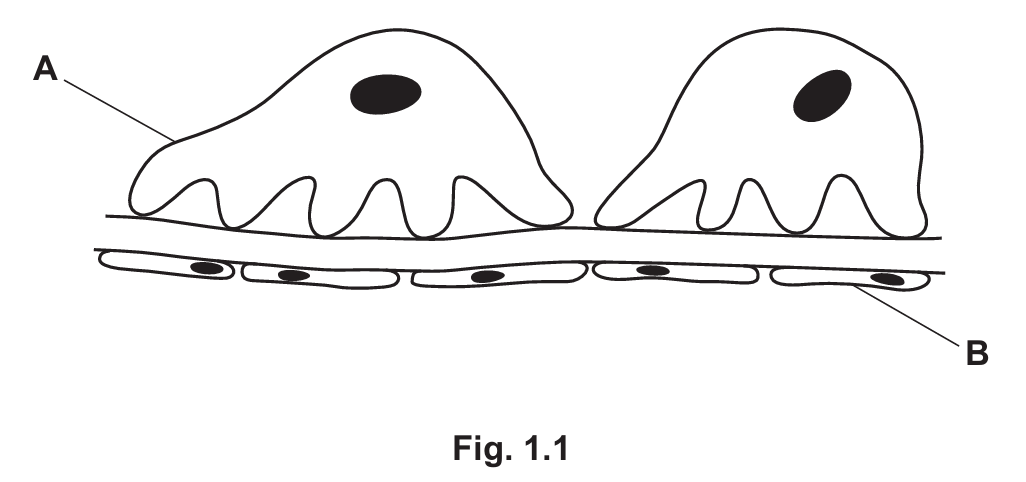
(i) Identify structures A and B.
(ii) The glomerular filtrate is produced in the Bowman’s capsule by the process of ultrafiltration.
State the conditions required for ultrafiltration.
(b) As the newly formed glomerular filtrate passes along the proximal convoluted tubule, selective reabsorption takes place. The fluid remaining in the proximal convoluted tubule eventually forms urine.
Table 1.1 lists three of the components of blood plasma that enter the glomerulus in a healthy person.
Complete Table 1.1 by writing:
- increased, if the component is present and is higher in concentration than in blood plasma
- decreased, if the component is present and is lower in concentration than in blood plasma
- same, if the component is present and is of the same concentration as blood plasma
- not present, if the component is absent.
You may use each response once, more than once or not at all.
| component of blood plasma entering glomerulus | component in newly formed glomerular filtrate | component in urine |
|---|---|---|
| glucose | ||
| large plasma proteins | ||
| urea |
(c) Sweating during exercise can lead to a response in the posterior pituitary gland and in the kidney.
State the response to sweating that occurs in the posterior pituitary gland and the response that occurs in the kidney.
▶️ Answer/Explanation
(a)(i)
A – podocyte
B – (capillary) endothelial cell
Explanation: In the diagram of Bowman’s capsule and glomerular capillary, structure A is identified as a podocyte, which are specialized cells that wrap around the capillaries of the glomerulus. Structure B is the endothelial cell that forms the wall of the glomerular capillary. These structures are crucial for the filtration process in the kidney.
(a)(ii)
1. High hydrostatic/blood pressure
2. Basement membrane acts as a filter/only small molecules can pass through basement membrane
Explanation: Ultrafiltration in the Bowman’s capsule requires two main conditions. First, there must be high hydrostatic pressure in the glomerular capillaries to force fluid and small molecules out of the blood. Second, the basement membrane acts as a selective filter, allowing small molecules like water, glucose, and urea to pass through while preventing larger molecules like proteins and blood cells from entering the filtrate.
(b)
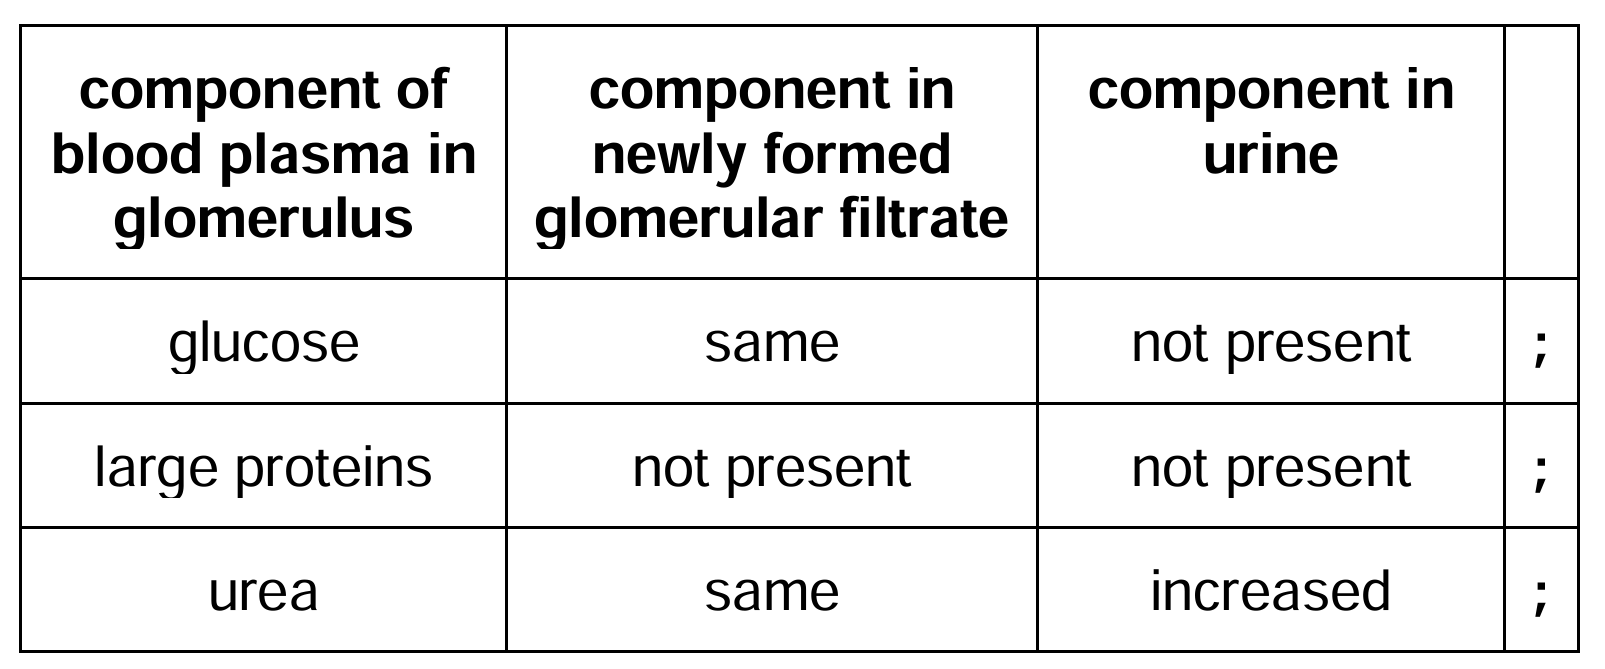
Explanation: In the glomerular filtrate, glucose concentration remains the same as in plasma because it’s freely filtered. However, in urine, glucose is completely reabsorbed in the proximal convoluted tubule, so it’s not present. Large plasma proteins are too big to be filtered, so they’re not present in either filtrate or urine. Urea is filtered at the same concentration as plasma but becomes more concentrated in urine as water is reabsorbed while urea is only partially reabsorbed.
(c)
Posterior pituitary gland – releases (more) ADH
Kidney – reabsorbs more water/urine more concentrated/lower volume of urine
Explanation: When sweating occurs during exercise, the body loses water, leading to increased blood osmolarity. This stimulates the posterior pituitary gland to release more antidiuretic hormone (ADH). In the kidney, ADH causes more water to be reabsorbed from the collecting ducts back into the blood, resulting in more concentrated urine with lower volume. This is a crucial homeostatic mechanism to conserve water when the body is losing it through sweating.
Topic: 17.1
Several different processes can affect allele frequencies in populations.
(a) Outline the processes that may affect allele frequencies in wildlife populations.
(b) The process of selective breeding changes allele frequencies in a population. Plant breeders use selective breeding to improve crop plants such as maize.
Explain how selective breeding can be used to obtain a variety of maize where the plants are vigorous and of uniform height.
▶️ Answer/Explanation
(a)
Processes affecting allele frequencies:
- Mutation: Random changes in DNA sequences that create new alleles in a population.
- Genetic drift: Random fluctuations in allele frequencies, especially significant in small populations.
- Founder effect: When a small group separates from the main population to establish a new population with different allele frequencies.
- Bottleneck effect: When a population undergoes a drastic reduction in size, leading to loss of genetic variation.
- Natural selection: Differential survival and reproduction of individuals with certain alleles (directional, disruptive, or stabilizing).
- Gene flow: Movement of alleles between populations through migration or interbreeding.
- Genetic recombination: New combinations of alleles created during meiosis through crossing over.
Explanation: These processes can change the genetic makeup of populations over time. Some (like genetic drift) are random, while others (like natural selection) are non-random. The effects are often more pronounced in smaller populations where chance events can have greater impact.
(b)
Selective breeding for vigorous, uniform maize:
- Inbreeding: Crossing closely related plants to produce homozygous lines with desired traits.
- Selection: Choosing parent plants that show vigor and uniform height over multiple generations.
- Hybridization: Crossing two purebred lines to produce hybrid offspring (F1 generation) that often show hybrid vigor (heterosis).
- Outbreeding: Introducing genetic variation from other populations if needed to maintain genetic diversity.
- Continuous evaluation: Monitoring plant characteristics over several growing seasons to ensure stability of traits.
Explanation: Selective breeding works by gradually increasing the frequency of alleles associated with desired traits. The F1 hybrids from two purebred lines will be genetically uniform (all heterozygous) and often show increased vigor. Maintaining these characteristics requires careful selection and sometimes introducing new genetic material to prevent inbreeding depression.
Topic: 19.1
The treatment of many diseases has been improved by the use of genetic technology in medicine.
(a) Explain what is meant by genetic engineering.
(b)(i) Leber Congenital Amaurosis (LCA) is an inherited eye disease. In LCA, the photoreceptor cells in the retina die at an early age. This causes impaired vision (reduced eyesight) in children, which can progress to blindness.
Mutations in different genes cause different forms of LCA. One form of this disease, LCA2, is caused by a mutation in the RPE65 gene. Gene therapy has been used to treat LCA2.
Outline how an inherited eye disease, such as LCA2, is treated with gene therapy.
(ii) Suggest why the eye is a suitable organ for gene therapy.
(c) LCA10 is a different form of LCA caused by a recessive mutation in the CEP290 gene. This gene codes for the protein CEP290, which is involved in the correct functioning of photoreceptor cells in the retina.
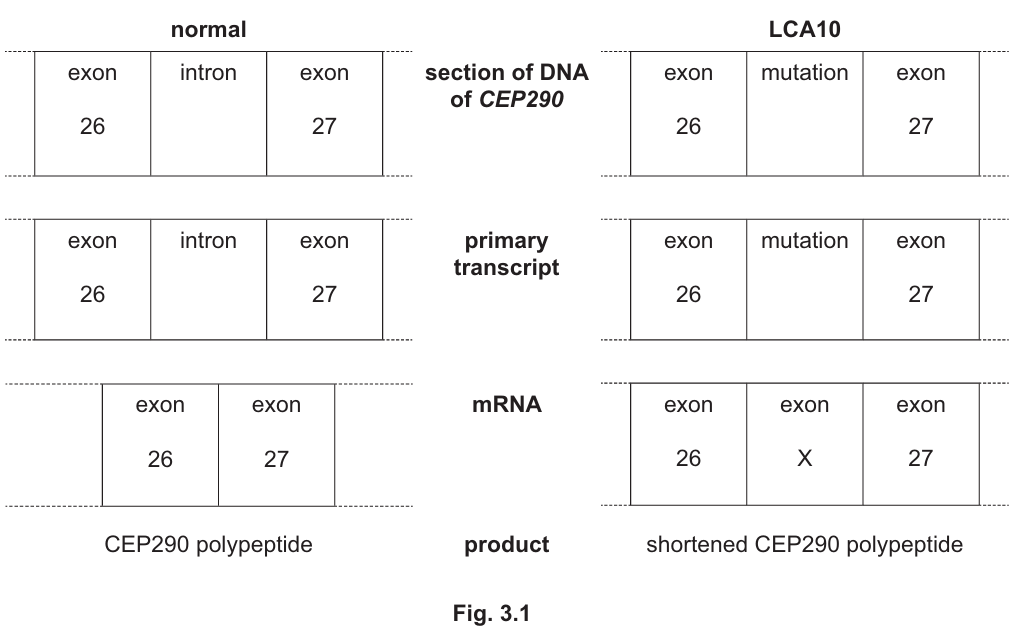
The mutation in CEP290 causes an error to be made when the primary transcript is spliced to form messenger RNA (mRNA). The abnormal mRNA that is formed has an extra sequence of RNA nucleotides, known as exon X, between exon 26 and exon 27. Exon X contains a STOP codon.
Fig. 3.1 compares the effect of the mutation in CEP290 with the normal gene expression.
In 2022, research was carried out into possible treatment of LCA10 using genetic technology.
(i) A human clinical trial investigated a treatment of LCA10 using a short RNA nucleotide sequence known as Sepofarsen.
Sepofarsen binds to the section of the primary transcript containing the CEP290 mutation so that normal splicing occurs and functional CEP290 protein is synthesised.
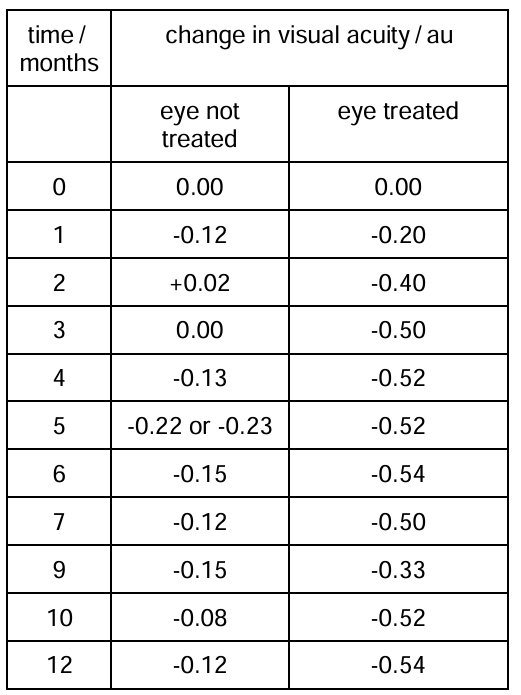
- People in the clinical trial received regular treatment with Sepofarsen to the eye with the greatest loss of vision (treated eye) for a period of 12 months.
- Changes in the light perception (visual acuity) of both eyes were measured using a vision chart.
- A negative change in the visual acuity score shows an improvement in visual acuity.
Fig. 3.2 shows the results of the clinical trial over 12 months.
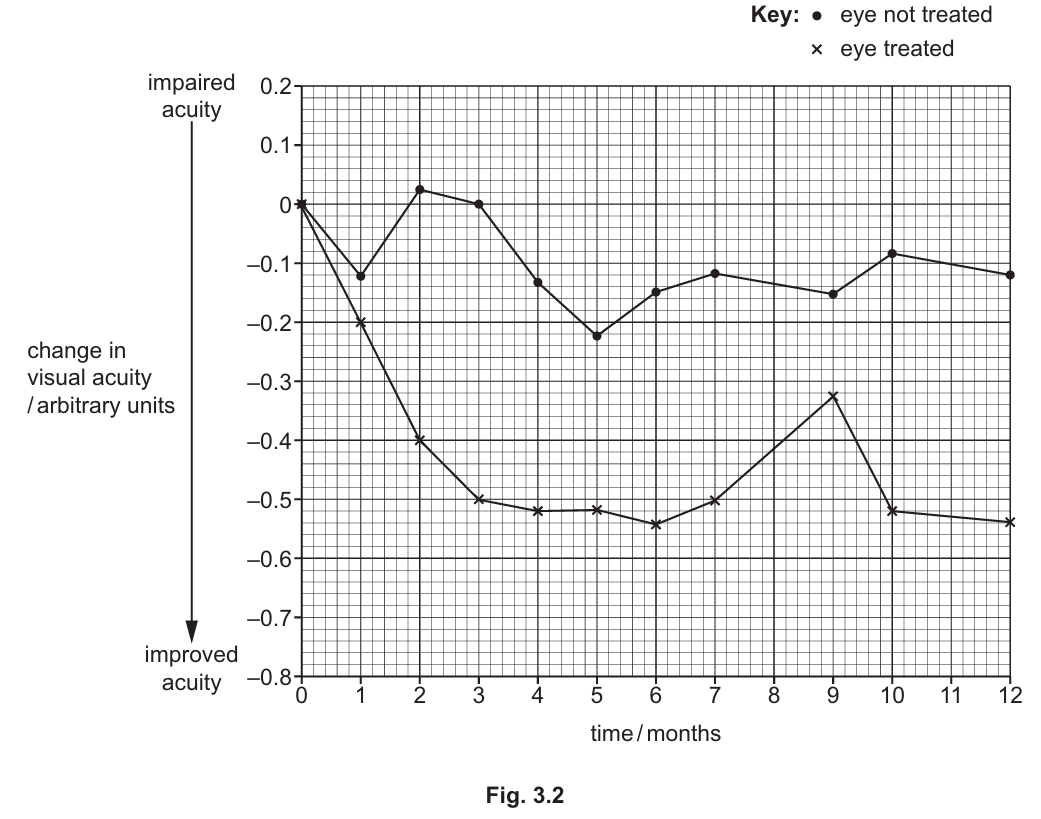
Describe the results of the clinical trial data shown in Fig. 3.2.
(ii) Another method being investigated to treat LCA10 is to use a gene editing tool known as the CRISPR/Cas9 system.
The CRISPR/Cas9 system uses a short length of RNA called guide RNA. Guide RNA is complementary to the target DNA and is linked to a nuclease enzyme called Cas9. Cas9 breaks phosphodiester bonds in DNA.
The cell repair mechanisms repair the cut in DNA after the modification has taken place.
- A vector delivers Cas9 and two specific guide RNAs to the photoreceptor cells.
- They act on the section of DNA which contains the mutation.
- Exon X is no longer added to the mRNA.
Explain how this method used to treat LCA10 is an example of gene editing.
▶️ Answer/Explanation
(a) Genetic engineering refers to the direct manipulation of an organism’s genes using biotechnology. It involves:
- Isolating and modifying specific genes from one organism
- Inserting these genes into another organism’s genome
- Making the modified genes functional in the new host
- Resulting in the expression of new traits or characteristics
This technology allows scientists to alter the genetic makeup of organisms to achieve desired outcomes, such as producing medicines, improving crops, or treating genetic disorders.
(b)(i) Gene therapy for LCA2 involves:
- Identifying and isolating the healthy, functional version of the RPE65 gene
- Inserting this gene into a viral vector (typically an adeno-associated virus)
- Injecting the viral vector directly into the retina of the affected eye
- The virus delivers the healthy gene to retinal cells
- The healthy gene integrates into the cells’ DNA
- The cells then produce the functional RPE65 protein
- This restores the normal function of photoreceptor cells and improves vision
(b)(ii) The eye is particularly suitable for gene therapy because:
- It’s relatively isolated from the rest of the body, reducing systemic effects
- It’s small in size, requiring only small amounts of therapeutic agents
- It has immune privilege, meaning it’s less likely to mount an immune response against the therapy
- The retina is easily accessible for direct injection
- Changes in vision provide clear indicators of treatment effectiveness
(c)(i) The clinical trial results show:
(c)(ii) This is gene editing because:
- CRISPR/Cas9 directly modifies the patient’s DNA at the precise location of the mutation
- The guide RNA targets the specific sequence between exons 26 and 27 where the mutation occurs
- Cas9 makes a precise cut in the DNA at this location
- The cell’s repair mechanisms then fix the DNA, removing the mutation
- This results in normal mRNA splicing without the inclusion of exon X
- The repaired gene can now produce functional CEP290 protein
- Unlike gene therapy which adds new genes, this method repairs the existing faulty gene
Topic: 16.2
Genetic crosses can be used to investigate patterns of inheritance.
(a) A mutation in a gene involved in fruit colour in tomato plants, Solanum lycopersicum, results in the production of yellow fruits instead of red fruits.
A genetic cross was carried out between a pure breeding plant with a red fruit and a pure breeding plant with a yellow fruit to produce the F1 generation. All offspring plants produced red fruits.
The F1 plants were then crossed with each other and the seeds produced were planted to obtain the F2 generation.
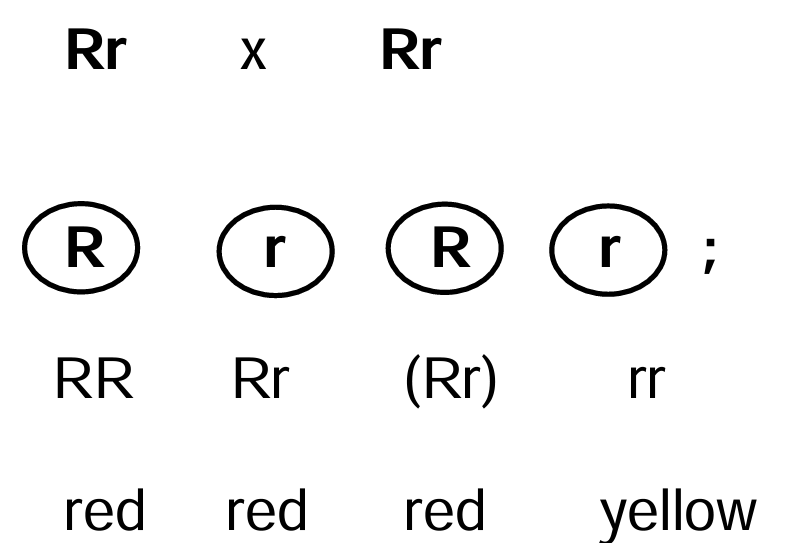
Construct a genetic diagram to show the cross of the F1 generation that produced this F2 generation.
Use the symbols R and r for the alleles.
(b) A theoretical dihybrid cross involves two genes located on different autosomes. Each gene has two alleles, one dominant and one recessive.
A parent, homozygous dominant for both genes, is crossed with a parent that is homozygous recessive for both genes. This produces F1 individuals that are then crossed to produce the F2 generation.
State the phenotypic ratio of this dihybrid F2 generation and explain why some of these offspring phenotypes are different from the original parental phenotypes.
▶️ Answer/Explanation
(a)
Genetic diagram:
Explanation:
1. The pure breeding red parent must be homozygous dominant (RR) and the yellow parent homozygous recessive (rr).
2. The F1 generation will all be heterozygous (Rr) and show the dominant red phenotype.
3. When F1 plants (Rr) are crossed, the Punnett square shows:
25% RR (red), 50% Rr (red), and 25% rr (yellow) in the F2 generation.
4. This demonstrates Mendel’s law of segregation with a 3:1 phenotypic ratio in the F2 generation.
(b)
Phenotypic ratio: 9:3:3:1
Explanation:
1. In a dihybrid cross with two independently assorting genes (A and B), the F1 generation will be AaBb.
2. When F1 individuals are crossed (AaBb × AaBb), the F2 generation shows:
– 9/16 with both dominant traits (A_B_)
– 3/16 with first dominant and second recessive (A_bb)
– 3/16 with first recessive and second dominant (aaB_)
– 1/16 with both recessive traits (aabb)
3. The new phenotypes (A_bb and aaB_) appear because of independent assortment during meiosis, where alleles of different genes separate independently of one another.
4. This recombination of alleles creates new combinations not seen in the original parents (AABB and aabb).
5. The 9:3:3:1 ratio demonstrates Mendel’s law of independent assortment.
Topic: 16.3
Phenotypic variation exists in natural populations. There are many causes of variation. Natural selection determines which phenotypes are advantageous.
(a) Variation in a particular characteristic can be described as either discontinuous or continuous.
Table 5.1 contains a list of statements that apply to discontinuous variation, continuous variation or both.
Complete both columns of Table 5.1. Put a tick (✓) in the box if the statement applies and leave the box empty if the statement does not apply.
Table 5.1
| statement | discontinuous variation | continuous variation |
|---|---|---|
| often involves one gene only | ||
| environmental factors may affect gene expression | ||
| there is an additive effect of genes that contributes to the phenotype | ||
| there are distinct differences between the various forms of a characteristic |
(b) There is variation in the quantity of vitamin D stored in the body.
Vitamin D has an important role in keeping bones healthy. The main storage form of vitamin D in the body is serum 25-hydroxyvitamin D (serum 25-OHD).
A study was carried out on 262 healthy women to investigate if the concentration of serum 25-OHD varied between summer and winter. The women had taken no vitamin D supplements. The age range of the women in the sample was 40 to 72 years old.
Table 5.2 shows the results of the study.
Table 5.2
| group | mean concentration of serum 25-OHD /ng cm-3 | standard deviation |
|---|---|---|
| sampled during summer (n = 138) | 32.7 | 7.6 |
| sampled during winter (n = 124) | 28.5 | 8.3 |
| whole sample (n = 262) | 30.7 | 8.2 |
Additional analysis showed that there was no significant correlation between age and serum 25-OHD concentration.
(i) Explain what is meant by standard deviation.
(ii) The t-test was used to compare the mean concentration of serum 25-OHD when sampled during the summer with the mean concentration of serum 25-OHD when sampled during the winter, as shown in Table 5.2.
Calculate the value of t using the formula provided.
\[t = \frac{| \overline{x}_1 – \overline{x}_2 |}{\sqrt{\left( \frac{s_1^2}{n_1} + \frac{s_2^2}{n_2} \right)}}\]
key to symbols:
\(\overline{x}\) = mean
\(s\) = sample standard deviation
\(n\) = sample size (number of observations)
Give your answer to four significant figures.
(iii) The critical value at the 0.0001 probability level is 3.773.
State the conclusion that can be made about the results of the study shown in Table 5.2 and explain how the result of your calculation in (b)(ii) can be used to support this conclusion.
(iv) Suggest the likely causes of variation in quantity of vitamin D stored in the body in this sample of women.
▶️ Answer/Explanation
(a)
| statement | discontinuous variation | continuous variation |
|---|---|---|
| often involves one gene only | ✓ | |
| environmental factors may affect gene expression | ✓ | |
| there is an additive effect of genes that contributes to the phenotype | ✓ | |
| there are distinct differences between the various forms of a characteristic | ✓ |
Explanation: Discontinuous variation is typically controlled by a single gene (Mendelian inheritance) and shows distinct categories (like blood groups). Continuous variation is influenced by multiple genes (polygenic inheritance) and environmental factors, showing a range of phenotypes (like height). The additive effect refers to how multiple genes contribute small effects to create a continuous range.
(b)(i) Standard deviation is a measure of how spread out the data points are from the mean value.
Explanation: A small standard deviation indicates that most data points are close to the mean, while a large standard deviation shows that the data points are more spread out. It helps understand the variability in the data set.
(b)(ii) t = 4.255
Calculation:
Given:
Summer: \(\overline{x}_1 = 32.7\), \(s_1 = 7.6\), \(n_1 = 138\)
Winter: \(\overline{x}_2 = 28.5\), \(s_2 = 8.3\), \(n_2 = 124\)
Plugging into the formula:
\[t = \frac{|32.7 – 28.5|}{\sqrt{\left(\frac{7.6^2}{138} + \frac{8.3^2}{124}\right)}} = \frac{4.2}{\sqrt{(0.4186 + 0.5554)}} = \frac{4.2}{\sqrt{0.974}} = \frac{4.2}{0.9869} = 4.255\]
(b)(iii) There is a significant difference between summer and winter serum 25-OHD concentrations.
Explanation: The calculated t-value (4.255) is greater than the critical value (3.773) at the 0.0001 probability level. This means the probability that the difference occurred by chance is less than 0.01%, so we can conclude the seasonal difference is statistically significant. The higher summer values are likely due to increased sunlight exposure enabling more vitamin D synthesis.
(b)(iv) The variation is likely due to both genetic factors (like differences in vitamin D metabolism) and environmental factors (like seasonal sunlight exposure and dietary intake).
Explanation: While the study shows seasonal (environmental) effects, individual variation within each season suggests genetic differences in vitamin D absorption, metabolism, or storage. Other environmental factors could include clothing habits (skin exposure), sunscreen use, and dietary sources of vitamin D.
Topic: 12.2
(a) DCPIP is an indicator and can be used to determine the rate of respiration of organisms such as yeast.
(i) State the category of indicators to which DCPIP belongs.
(ii) Describe the colour change that occurs in DCPIP during experiments to determine the rate of respiration.
(b) An investigation was carried out to determine the effect of temperature on the rate of respiration of yeast.
- A suspension of yeast cells was added to a test‑tube containing glucose solution.
- A further four test‑tubes were set up in the same way.
- One test‑tube was placed in a water‑bath at 10 °C for 5 minutes.
- DCPIP was added to the test‑tube and the time taken for the DCPIP to change colour was measured.
- The experiment was repeated using the other test‑tubes at 20 °C, 30 °C, 40 °C and 50 °C.
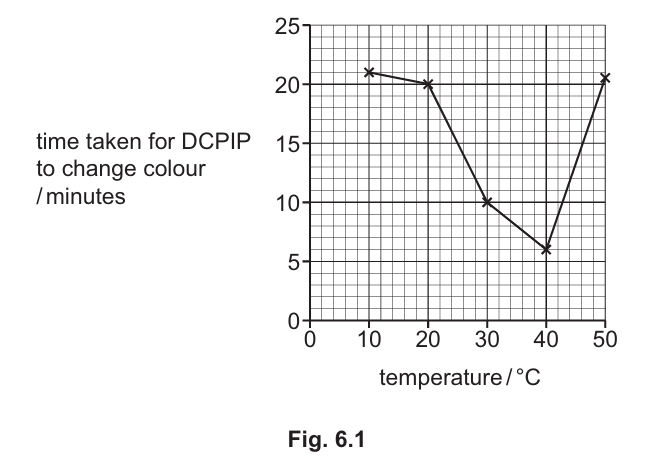
The results are shown in Fig. 6.1.
(i) State two variables that need to be kept constant in this experiment.
(ii) Explain the results shown in Fig. 6.1.
▶️ Answer/Explanation
(a)(i) Redox indicator.
Explanation: DCPIP (2,6-dichlorophenolindophenol) is classified as a redox indicator because it changes color in response to oxidation-reduction reactions. In respiration experiments, it acts as an electron acceptor, becoming reduced and changing color as it gains electrons from the respiratory electron transport chain.
(a)(ii) Blue to colorless.
Explanation: DCPIP starts as a blue solution in its oxidized form. As respiration occurs and electrons are transferred to DCPIP, it becomes reduced and changes to a colorless form. The faster this color change occurs, the higher the rate of respiration, as more electrons are being transferred per unit time.
(b)(i) Two variables to be kept constant:
- Volume/mass/concentration of yeast suspension
- Volume/mass/concentration of glucose solution
Explanation: These variables must be controlled to ensure a fair test. If the amount of yeast or glucose varied between tests, it would affect the rate of respiration independently of temperature, making the results invalid. Other potential controlled variables could include the volume/concentration of DCPIP, pH of the solution, or the time when DCPIP is added.
(b)(ii) Explanation of results:
The graph shows that as temperature increases from 10°C to 40°C, the time taken for DCPIP to change color decreases, indicating an increase in respiration rate. This occurs because:
- Higher temperatures increase kinetic energy of molecules, leading to more frequent and successful collisions between enzymes and substrates in respiration.
- More enzyme-substrate complexes form, increasing the rate of respiratory reactions that transfer electrons to DCPIP.
- The optimum temperature appears to be around 40°C where respiration is fastest (shortest time for color change).
Above 40°C, the time for color change increases again, indicating slower respiration. This is because:
- Enzymes involved in respiration begin to denature at higher temperatures.
- The active site shape changes, reducing enzyme-substrate binding.
- At extreme temperatures, enzymes may become completely non-functional.
The overall pattern shows the typical effect of temperature on enzyme activity – increasing rate up to an optimum, then decreasing as enzymes denature.
Topic: 13.1
(a) Paper chromatography is a technique that can be used to separate and identify different chloroplast pigments.
Describe how the results of paper chromatography can be used to identify chloroplast pigments.
(b) Carotene and xanthophyll are chloroplast pigments.
Describe the role played by these pigments in photosynthesis.
(c) The light-dependent stage of photosynthesis produces ATP and reduced NADP, which are used in the light-independent stage.
Describe the light-independent stage of photosynthesis.
▶️ Answer/Explanation
(a)
1. Calculate Rf values for each pigment spot using the formula:
Rf = distance moved by pigment / distance moved by solvent
2. Compare these calculated Rf values with known standard values from reference tables or databases.
3. Each pigment has a characteristic Rf value under specific solvent conditions, allowing identification.
4. The position and color of the spots on the chromatogram can also help identify specific pigments based on their known properties.
Explanation: Paper chromatography separates pigments based on their solubility and affinity for the mobile phase (solvent) versus the stationary phase (paper). More soluble pigments travel further, resulting in different Rf values. By comparing these values with standards, we can identify chlorophyll a, chlorophyll b, carotene, and xanthophylls based on their characteristic positions and colors.
(b)
1. These accessory pigments absorb light wavelengths that chlorophyll a cannot absorb, expanding the range of light energy available for photosynthesis.
2. They transfer the absorbed light energy to chlorophyll a at the reaction center through resonance energy transfer.
3. They protect chlorophyll from photo-oxidation by dissipating excess light energy as heat.
4. They contribute to the light-harvesting complex, increasing the efficiency of light absorption.
Explanation: Carotene (orange pigment) primarily absorbs blue-green light, while xanthophylls (yellow pigments) absorb blue light. By capturing different wavelengths than chlorophyll, they increase the spectrum of light that can be used for photosynthesis. Their molecular structure allows efficient energy transfer to the reaction center while also providing photoprotection when light intensity is too high.
(c)
1. Carbon dioxide combines with ribulose bisphosphate (RuBP) in a reaction catalyzed by rubisco, forming an unstable 6-carbon compound.
2. This immediately splits into two molecules of glycerate 3-phosphate (GP).
3. GP is reduced to triose phosphate (TP) using ATP and reduced NADP from the light-dependent stage.
4. Some TP molecules are used to regenerate RuBP through a complex series of reactions requiring ATP.
5. Other TP molecules are converted into useful organic compounds like glucose, amino acids, or lipids.
6. The cycle continues as more CO2 is fixed, with RuBP being constantly regenerated.
Explanation: Also known as the Calvin cycle, the light-independent stage occurs in the stroma of chloroplasts. It doesn’t require light directly but depends on the ATP and NADPH produced in the light-dependent reactions. The cycle must turn six times to produce one glucose molecule, incorporating six CO2 molecules. The key enzyme rubisco is probably the most abundant protein on Earth, highlighting the importance of this process in global carbon fixation.
Topic: 15.1
(a) Fig. 8.1 is a diagram of a motor neurone.
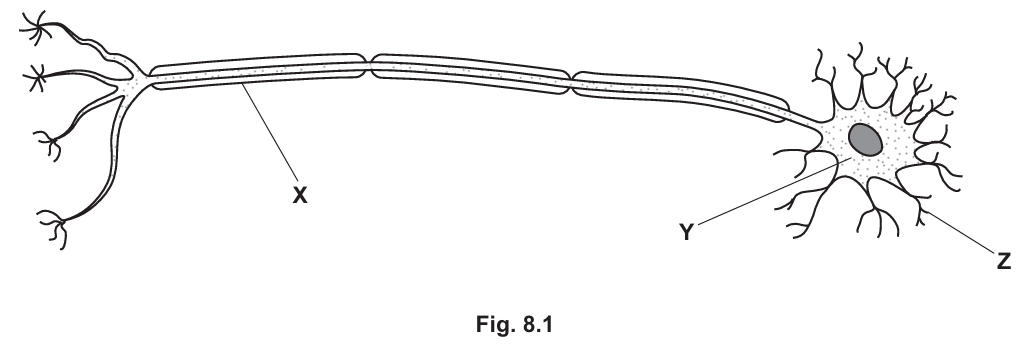
(i) Name cell X and part Y.
(ii) Name a type of cell that forms a synapse with structure Z.
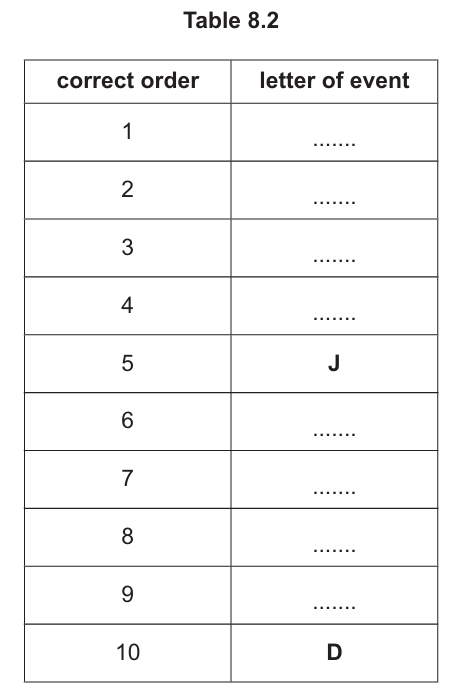
(b) Table 8.1 shows some of the events that occur during muscle contraction. They are not listed in the correct order.
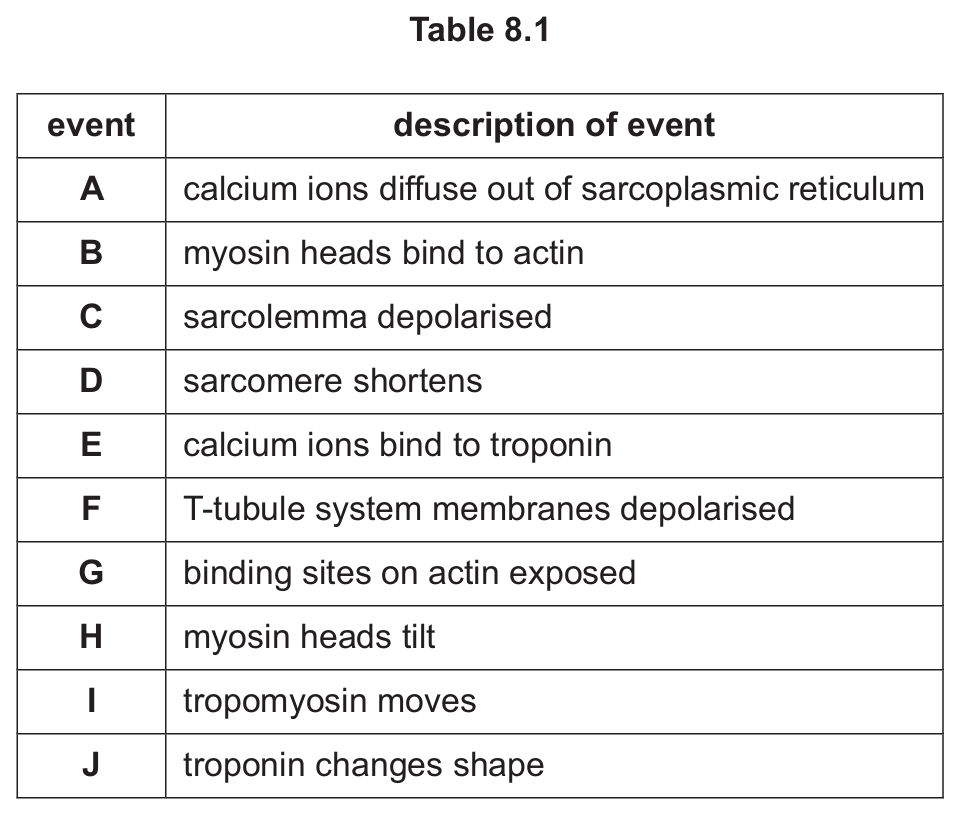
Complete Table 8.2 to show the correct order of the events that occur during muscle contraction. Two of the events have been completed for you.
(c) Lambert-Eaton myasthenic syndrome (LEMS) is a rare disorder of the neuromuscular junction. A person with LEMS produces antibodies that bind to the voltage-gated calcium channels on the presynaptic knob. One symptom of LEMS is weaker muscle contraction.
Suggest and explain why LEMS leads to weaker muscle contraction.
▶️ Answer/Explanation
(a)(i)
X – Schwann cell
Y – cell body
Explanation: In the motor neurone diagram, X is the Schwann cell which produces the myelin sheath that insulates the axon. Y is the cell body (or soma) which contains the nucleus and other organelles essential for neuronal function.
(a)(ii)
Intermediate neurone (or relay neurone or sensory neurone)
Explanation: Structure Z represents the synaptic terminal which forms synapses with other neurones (like intermediate or sensory neurones) or with muscle fibers. In the context of motor neurones, it typically forms neuromuscular junctions with muscle cells.
(b)
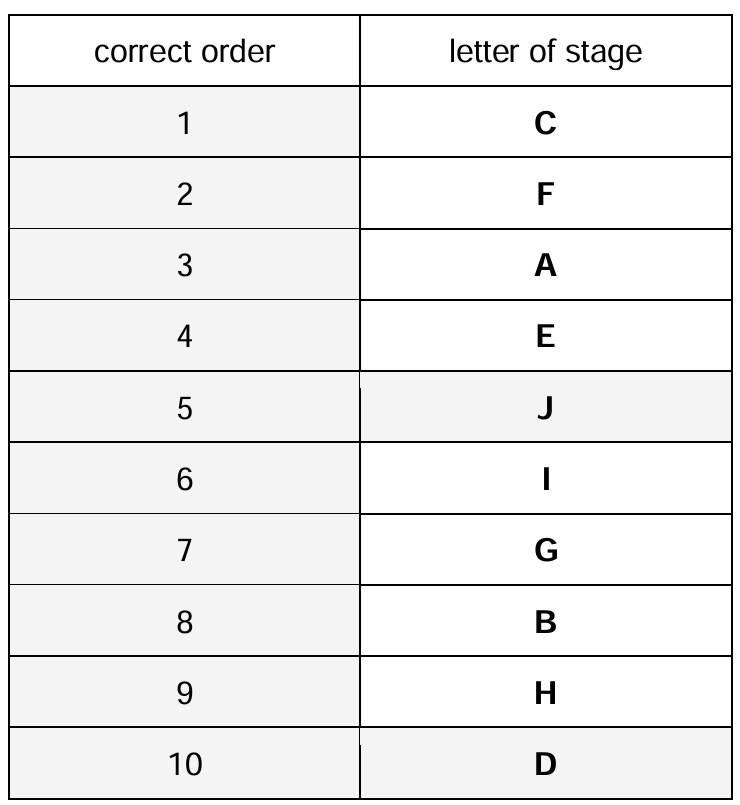
Explanation: The correct sequence of muscle contraction begins with depolarization of the sarcolemma (C), which spreads through T-tubules (F), causing calcium release from SR (A). Calcium binds troponin (E), changing its shape (J), which moves tropomyosin (I), exposing actin binding sites (G). Myosin heads bind actin (B), tilt (H), causing sarcomere shortening (D).
(c)
LEMS leads to weaker muscle contraction because:
- Antibodies block voltage-gated calcium channels on the presynaptic knob, reducing calcium entry.
- Less calcium means fewer synaptic vesicles fuse with the presynaptic membrane.
- Less acetylcholine (ACh) neurotransmitter is released into the synaptic cleft.
- Fewer ACh receptors on the muscle fiber are activated, resulting in weaker depolarization.
- This leads to fewer action potentials in the muscle fiber and less calcium release from sarcoplasmic reticulum.
- Ultimately, fewer cross-bridges form between actin and myosin, producing weaker contractions.
Explanation: The antibodies in LEMS specifically target the calcium channels needed for neurotransmitter release. Without sufficient calcium influx, the normal chain of events in neuromuscular transmission is impaired at the very first step, leading to weaker muscle activation despite normal neural signals.
Topic: 18.3
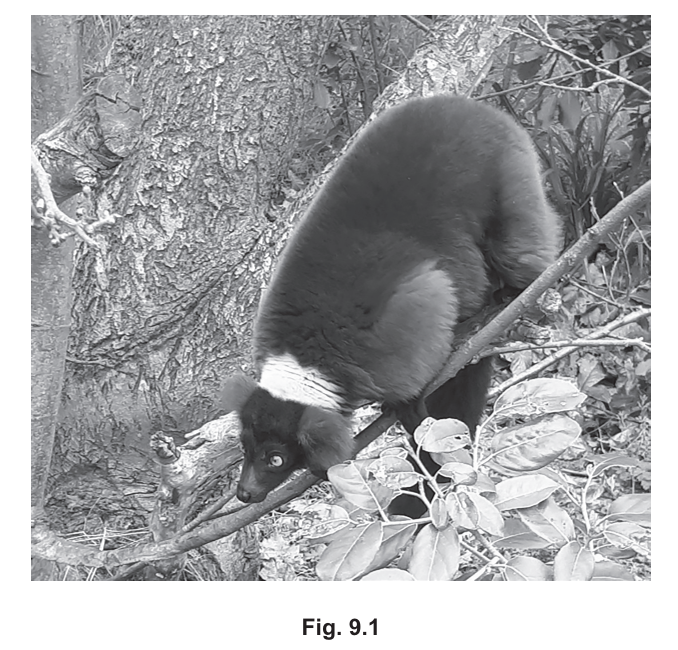
The red ruffed lemur, Varecia rubra, is a mammal found only in the rainforests of the Masoala region in north east Madagascar.
Fig. 9.1 shows a red ruffed lemur.
(a) The International Union for Conservation of Nature (IUCN) Red List of Threatened Species™ states that the red ruffed lemur is critically endangered.
Suggest why the red ruffed lemur has become critically endangered.
(b) Many zoos around the world operate captive breeding programmes for the red ruffed lemur.
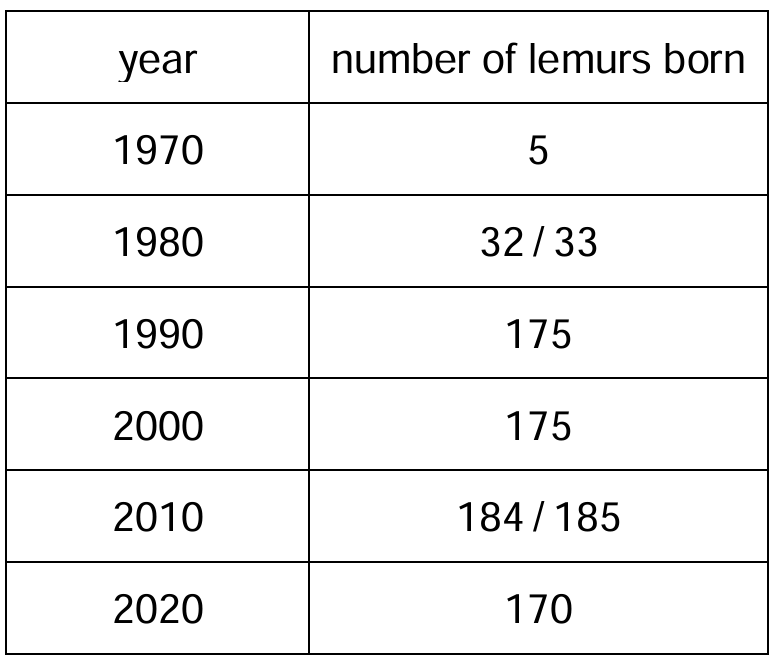
Fig. 9.2 shows the numbers of captive-born red ruffed lemurs in North American zoos from 1970 to 2020.
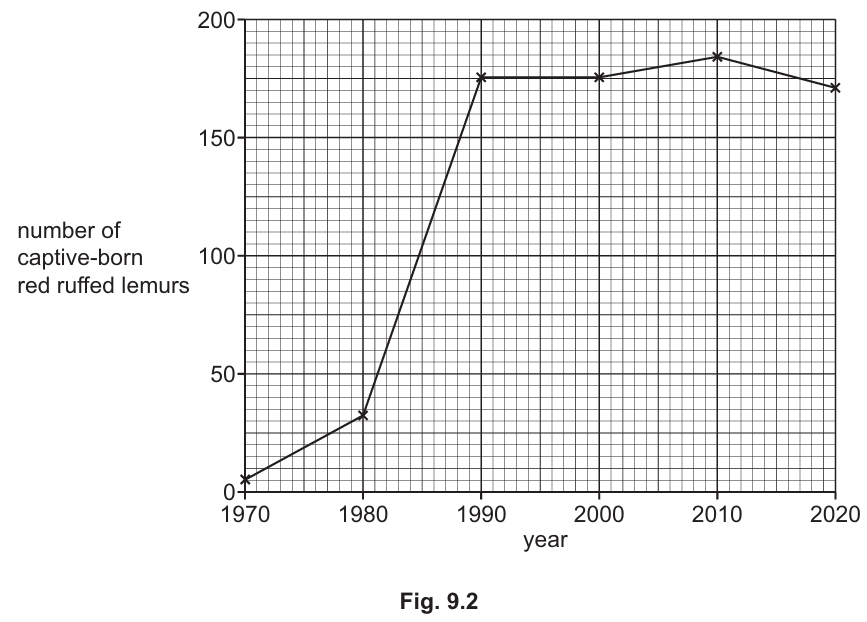
Describe the results shown in Fig. 9.2.
(c) Captive breeding programmes for endangered mammals such as the red ruffed lemur can vary in their success rate.
(i) Suggest problems that may affect the success of captive breeding programmes of mammals like the red ruffed lemur.
(ii) Occasionally, wild-caught red ruffed lemurs are introduced into captive breeding programmes.
Suggest why this is done.
▶️ Answer/Explanation
(a)
The red ruffed lemur has become critically endangered due to several factors:
- Habitat loss: Deforestation for agriculture, logging, and human settlement has dramatically reduced their natural habitat in Madagascar.
- Hunting and poaching: They are hunted for bushmeat and sometimes captured for the illegal pet trade.
- Climate change: Changes in weather patterns affect their food sources and breeding cycles.
- Limited range: Being endemic to a small region makes them particularly vulnerable to local environmental changes.
- Natural disasters: Cyclones and other natural events in Madagascar can devastate local populations.
These combined pressures have caused a rapid decline in wild populations, leading to their critically endangered status.
(b)
The graph shows:
- A steep increase in captive-born lemurs from 1980 (about 30) to 1990 (about 175), indicating successful establishment of breeding programs.
- The population plateaus after 1990, fluctuating between 170-185 individuals, suggesting the programs reached carrying capacity.
- From 1970-1980 there was slow growth (5 to 32), likely representing initial challenges in breeding.
- The stable numbers since 1990 show the programs have been maintaining but not significantly expanding the captive population.
This pattern suggests initial success in establishing breeding populations, followed by stabilization as zoos reached their capacity for housing these animals.
(c)(i)
Problems affecting captive breeding success include:
- Behavioral issues: Captive environments may not stimulate natural mating behaviors, leading to low reproduction rates.
- Genetic diversity: Small founder populations can lead to inbreeding and reduced genetic health.
- Space limitations: Zoos have finite space, restricting population growth.
- Dietary challenges: Replicating their natural diet in captivity can be difficult, affecting health and reproduction.
- Stress: Captivity can cause chronic stress, lowering immune function and reproductive success.
- High costs: Maintaining specialized facilities and staff for proper care requires significant funding.
(c)(ii)
Introducing wild-caught individuals serves several purposes:
- Genetic diversity: New genes are introduced to the captive population, reducing inbreeding depression.
- Behavioral enrichment: Wild-born individuals can teach captive-born ones natural behaviors.
- Population boost: They can immediately contribute to breeding efforts.
This practice helps maintain the health and viability of captive populations, though it must be done carefully to avoid depleting wild populations further.
Topic: 14.2
(a) Blood glucose concentration is maintained around a set point by homeostasis.
Explain the principles of homeostasis.
(b) Glycogen phosphorylase catalyses the conversion of glycogen to glucose in liver cells. The production of glycogen phosphorylase is coded for by the gene PYGL.
A mutation in PYGL leads to a condition called glycogen storage disease type VI (GSDVI), in which glycogen is not broken down efficiently.
Suggest and explain why cell signalling by glucagon is likely to be affected in the liver cells of a person with GSDVI.
(c) Glycogen synthase catalyses the conversion of glucose to glycogen in liver cells. The production of glycogen synthase is coded for by the gene GYS2.
A mutation in GYS2 leads to a condition called glycogen storage disease type 0 (GSD0) in which glycogen is not formed efficiently.
Suggest what the consequences would be if a person with GSD0 has a meal rich in glucose.
▶️ Answer/Explanation
(a)
Homeostasis maintains stable internal conditions through several key principles:
- Detection: Specialized receptors detect changes in internal conditions (like blood glucose levels).
- Coordination: The central nervous system or endocrine system processes this information.
- Response: Effectors (muscles or glands) carry out corrective actions through impulses or hormones.
- Negative feedback: The response counteracts the initial change, bringing the system back to its set point.
- Dynamic equilibrium: The system continuously makes small adjustments to maintain stability.
For blood glucose specifically, when levels rise after eating, insulin is released to promote glucose uptake and storage. When levels fall, glucagon is released to stimulate glucose release from glycogen stores.
(b)
In GSDVI, the mutation affects glycogen phosphorylase in several ways:
- The glucagon signaling pathway remains intact initially – glucagon still binds to receptors, activates G proteins, and stimulates adenylate cyclase to produce cAMP.
- However, the final step in the pathway is compromised because the glycogen phosphorylase enzyme is either:
- Not produced in sufficient quantities
- Produced in a non-functional form due to altered tertiary structure
- As a result, even with proper signaling, glycogen cannot be effectively broken down into glucose (glycogenolysis is impaired).
- This leads to hypoglycemia (low blood sugar) because the liver cannot release glucose when needed, despite receiving proper glucagon signals.
(c)
After a glucose-rich meal, a person with GSD0 would experience:
- Impaired glycogen storage: Due to deficient or non-functional glycogen synthase, glucose cannot be effectively converted to glycogen for storage.
- Hyperglycemia: Blood glucose levels would remain elevated longer than normal because the usual storage mechanism is impaired.
- Alternative pathways activated: Excess glucose would be:
- Converted to fat through lipogenesis
- Excreted in urine if levels exceed the renal threshold (glycosuria)
- Metabolic consequences: This could lead to symptoms like:
- Increased thirst and urination
- Fatigue due to inefficient energy storage
- Potential ketoacidosis if the body starts breaking down fats excessively
The condition demonstrates the critical role of glycogen synthase in maintaining glucose homeostasis after meals.