Question 1
Topic – ALV: 6.4
In a survey of 200 randomly chosen students from a certain college, 23% of the students said that they owned a car.
Calculate an approximate 93% confidence interval for the proportion of students from the college who own a car.
▶️Answer/Explanation
Solution:-
1 $0.23 \pm z \times \sqrt{\frac{0.23 \times (1-0.23)}{200}}$
$z = 1.811 \text{ or } 1.812$
0.176 to 0.284 (3 sf)
Question 2
Topic – ALV: 6.1
(a) The random variable W has a Poisson distribution.
State the relationship between E(W) and Var(W).
(b) The random variable X has the distribution B(n, p). Jyothi wishes to use a Poisson distribution as an approximate distribution for X.
Use the formulae for E(X) and Var(X) to explain why it is necessary for p to be close to 0 for this to be a reasonable approximation.
(c) Given that Y has the distribution B(20000, 0.00007), use a Poisson distribution to calculate an estimate of P(Y > 2).
▶️Answer/Explanation
Solution:-
(a) $E(W) = Var(W).$
(b) $np \approx np(1-p), \text{ hence } 1-p \text{ must be close to } 1$
(c) $\lambda = 1.4$
$1-e^{-1.4}(1+1.4+\frac{1.4^{2}}{2})$ or $1-e^{-1.4}(1+1.4+0.98)$ or $1-(0.2466+0.3452+0.2417)$
= 0.167 (3 sf) or 0.166
Question 3
Topic – ALV: 6.4
The masses, in kilograms, of newborn babies in country A are represented by the random variable X, with mean $\mu$ and variance $\sigma^2$. The masses of a random sample of 500 newborn babies in this country were found and the results are summarised below.
$$n=500$$
$$\Sigma x=1625$$
$$\Sigma x^{2}=5663.5$$
(a) Calculate unbiased estimates of $\mu$ and $\sigma^2$.
A researcher wishes to test whether the mean mass of newborn babies in a neighbouring country, B, is different from that in country A. He chooses a random sample of 60 newborn babies in country B and finds that their sample mean mass is 2.95 kg.
Assume that your unbiased estimates in part (a) are the correct values for $\mu$ and $\sigma^2$. Assume also that the variance of the masses of newborn babies in country B is the same as in country A.
(b) Carry out the test at the 1% significance level.
▶️Answer/Explanation
Solution:-
(a) $Est(\mu) = 3.25 = 13/4 \text{ or } 1625/500$
$Est(\sigma^2) = \frac{500}{499}(\frac{5663.5}{500} – ‘3.25’^2) \text{ or } \frac{1}{499}\left(5663.5 – \frac{1625^2}{500}\right)$
= 0.766 (3 sf) \text{ or } 1529/1996
(b) $H_0: \text{Pop mean (or } \mu \text{) = ‘3.25’}$
$H_1: \text{Pop mean (or } \mu \text{) } \neq \text{ ‘3.25’ }$
$\frac{2.95 – ‘3.25’}{\sqrt{‘0.766’}/\sqrt{60}}$
= -2.655
$’2.655′ > 2.576 \text{ or } ‘-2.655’ < -2.576$
[Reject H_0]
There is evidence that (mean) mass in (country B) is different (from country A).
Question 4
Topic – ALV: 6.1
The number, X, of books received at a charity shop has a constant mean of 5.1 per day.
(a) State, in context, one condition for X to be modelled by a Poisson distribution.
Assume now that $X$ can be modelled by a Poisson distribution.
(b) Find the probability that exactly 10 books are received in a 3-day period.
(c) Use a suitable approximating distribution to find the probability that more than 180 books are received in a 30-day period.
The number of DVDs received at the same shop is modelled by an independent Poisson distribution
with mean 2.5 per day.
(d) Find the probability that the total number of books and DVDs that are received at the shop in
1 day is more than 3.
▶️Answer/Explanation
Solution:-
(a) $\text{Books received independently or singly or randomly.}$
(b) $e^{-15.3} \times \frac{15.3^{10}}{10!}$
= 0.0439 (3sf)
(c) N(153, 153)
$\frac{180.5-153}{\sqrt{153}}$ $[= 2.223]$
$1 – \Phi(‘2.223’)$
= 0.0131 (3sf)
(d) $(\lambda = 5.1 + 2.5)$ $[= 7.6]$
$1 – e^{-7.6}(1+7.6+\frac{7.6^{2}}{2}+\frac{7.6^{3}}{3!}) = 1 – e^{7.6}(1+7.6+28.88+73.16)$
= 1 – (0.0005005+0.003803+0.01445+0.03661)
= 0.945 (3sf)
Question 5
Topic – ALV: 6.2
(a) Two random variables X and Y have the independent distributions N(7, 3) and N(6, 2) respectively. A random value of each variable is taken.
Find the probability that the two values differ by more than 2.
(b) Each candidate’s overall score in a science test is calculated as follows. The mark for theory
is denoted by T, the mark for practical is denoted by P, and the overall score is given by
T + 1.5P. The variables T and P are assumed to be independent with distributions N(62, 158)
and N(42, 108) respectively. You should assume that no continuity corrections are needed when
using these distributions.
(i) A pass is awarded to candidates whose overall score is at least 90.
Find the proportion of candidates who pass.
(ii) Comment on the assumption that the variables T and P are independent.
▶️Answer/Explanation
Solution:-
(a) $E(X-Y)=1~Var(X-Y)=5$
$\frac{2-1}{\sqrt{5}} [= 0.447]$ $\frac{-2-1}{\sqrt{5}} [= -1.342]$
$1-\Phi(‘0.447’)$ $\Phi(-‘1.342’)=1-\Phi(‘1.342’)$
= 0.327 or 0.328 = 0.0898 or 0.0899
Probability that difference is more than 2 = 0.417 (3 sf) or 0.418
(b)(i) $E(X)=62+1.5(42)$ $[= 125]$
$Var(X)=158+1.5^2 \times 108$ $[= 401]$
$\frac{90-‘125’}{\sqrt{‘401’}} [= -1.748]$
$\Phi(‘1.748’)$
= 0.960 or 96.0% (3 sf)
(b)(ii) Unlikely. A candidate who does well in Theory is likely to do well in
Practical.
Question 6
Topic – ALV: 6.4
When a child completes an online exercise called a Mathlit, they might be awarded a medal. The
publishers claim that the probability that a randomly chosen child who completes a Mathlit will be
awarded a medal is \frac{1}{3}. Asha wishes to test this claim. She decides that if she is awarded no medals
while completing 10 Mathlits, she will conclude that the true probability is less than \frac{1}{3}.
(a) Use a binomial distribution to find the probability of a Type I error.
The true probability of being awarded a medal is denoted by p.
(b) Given that the probability of a Type II error is 0.8926, find the value of p.
▶️Answer/Explanation
Solution :-
(a) $\left(1-\frac{1}{3}\right)^{10}$
= 0.0173 (3 sf)
(b) $1-(1-p)^{10}=0.8926$
$1-p=0.1074^{0.1}$ $[= 0.800]$
$p=0.200$ (3 sf) or 0.2
Question 7
Topic – ALV: 6.3
(a)
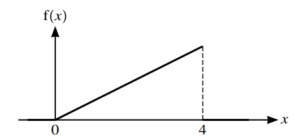
The diagram shows the graph of the probability density function, f, of a random variable X which
takes values between 0 and 4 only. Between these two values the graph is a straight line.
(i) Show that $f(x) = kx$ for $0 \le x \le 4$, where k is a constant to be determined.
(ii) Hence, or otherwise, find $E(X)$.
(b)
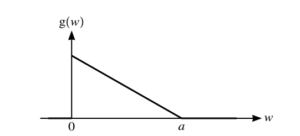
The diagram shows the graph of the probability density function, g, of a random variable W
which takes values between 0 and a only, where $a > 0$. Between these two values the graph is a
straight line.
Given that the median of W is 1, find the value of a.
▶️Answer/Explanation
Solution :-
(a)(i) $\frac{1}{2} \times 4 \times a = 1$
$[a = \frac{1}{2}] f(x) = \frac{1}{8}x$
(a)(ii) $\int_{0}^{4}x \times \frac{1}{8}x~dx$
$\left[\frac{x^{3}}{24}\right]_{0}^{4}$
= $\frac{8}{3}$ or 2.67 (3 sf)
(b) $\frac{a-1}{a}=\frac{1}{\sqrt{2}}$
$a\sqrt{2}-\sqrt{2}=a$
$a=2+\sqrt{2}=3.41$