A respirometer is a piece of apparatus that can be used to measure the rate of respiration of living tissue such as germinating peas.
A simple respirometer is shown in Fig. 6.1.

A student carried out an investigation to determine the effect of temperature on the rate of respiration of germinating peas.
• The student set up the respirometer as shown in Fig. 6.1 and placed the respirometer in a water-bath at 10°C.
• After five minutes, the student used the syringe to adjust the position of the coloured liquid in the right-hand side of the U-shaped tube so that it lined up with 0cm on the ruler. The student immediately started a timer.
• The germinating peas used up oxygen, causing the coloured liquid in the U-shaped tube to move.
• The student measured the distance moved by the coloured liquid after 20 minutes.
• The student repeated the experiment at temperatures of 20°C, 30°C, 40°C and 50°C.
(a) State the function of the potassium hydroxide solution used in the investigation.
(b) Suggest how the validity of the results could be assessed.
(c) Explain why the respirometer was left in the water-bath for five minutes before starting the experiment.
(d) The rate of movement of the coloured liquid in the U-shaped tube, calculated from the results, is shown in Table 6.1.

Plot a graph of the results shown in Table 6.1 on the grid in Fig. 6.2. Draw a curved line of best fit.

(e) The rate of movement of the coloured liquid is related to the rate of respiration.
Explain the effect of temperature on the rate of respiration shown in Table 6.1 and Fig. 6.2.
▶️ Answer/Explanation
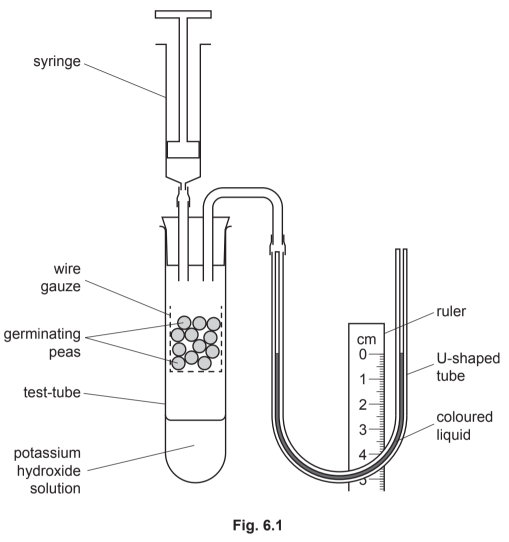
(a) Absorb carbon dioxide (produced by peas).
Explanation: KOH reacts with CO2 to form K2CO3, ensuring only oxygen consumption affects liquid movement.
(b) Repeat experiments and calculate standard deviation.
Explanation: Consistency across repeats and statistical analysis (e.g., low SD) confirm reliability. A control (e.g., glass beads) validates that liquid movement is due to respiration.
(c) Allow temperature equilibration.
Explanation: The 5-minute delay ensures the respirometer and peas reach the water-bath temperature, eliminating thermal expansion artifacts.
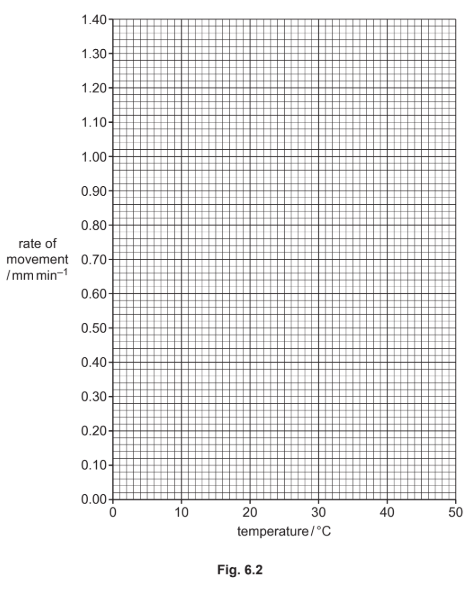
(d)

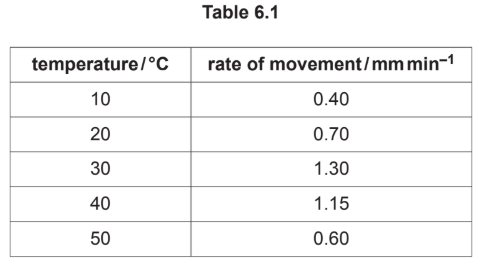
Explanation: Points plotted at (10°C, 0.2), (20°C, 0.4), (30°C, 0.6), (40°C, 0.5), (50°C, 0.3). A smooth curve peaks at 30°C, showing optimal temperature.
(e) Rate increases up to 30°C due to enhanced enzyme activity, then declines as enzymes denature.
Explanation: 1. Increase (10–30°C): Higher kinetic energy boosts enzyme-substrate collisions (Q10 effect).
2. Decline (>30°C): Enzymes (e.g., cytochrome oxidase) denature, reducing active site efficiency.
3. Optimum at 30°C: Peak respiration rate aligns with maximum enzyme stability.