Home / A level Biology 13.2 Investigation of limiting factors – Exam style question – Paper 4

A level Biology 13.2 Investigation of limiting factors – Exam style question – Paper 4

Question

(a) Experiments were carried out to determine the effect of light intensity on the rate of photosynthesis of a species of the unicellular protoctist, Chlorella. A cell suspension of Chlorella was used. Carbon dioxide uptake was used as a measure of the rate of photosynthesis.

  • The suspension of Chlorella was illuminated at a light intensity of 3 lux for 20 seconds.
  • The carbon dioxide uptake by Chlorella was measured at the end of the 20 second period of illumination.
  • The experiment was repeated at 6 lux, 9 lux, 12 lux and in a dark room.
  • The suspension was maintained at a temperature of 20°C.

Table 7.1 shows the results of the experiments.

Table 7.1: CO₂ uptake at different light intensities

(i) Use Table 7.1 to calculate the rate of photosynthesis at a light intensity of 6 lux. Complete Table 7.1 by writing your calculated value in the space provided.

(ii) Plot a graph of the data in Table 7.1 on the grid in Fig. 7.1 to show the effect of light intensity on the rate of photosynthesis. Draw a curve and extend your curve to show what would happen to the rate of photosynthesis if the experiment is carried out at 18 lux.

Fig. 7.1: Graph grid for plotting

(iii) Suggest an explanation for the shape of your curve from 12 lux to 18 lux.

(b) In photophosphorylation, photoactivation of chlorophyll results in the synthesis of ATP. Describe how photoactivation of chlorophyll results in the synthesis of ATP in photophosphorylation.

▶️ Answer/Explanation
Solution

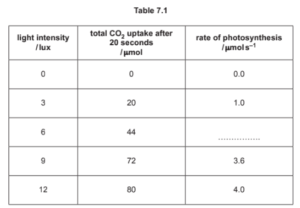
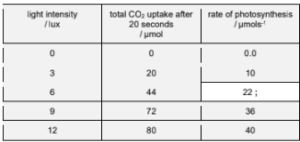
(a)(i) Rate at 6 lux = 0.30 μmol CO₂ per 20 seconds = 0.015 μmol/s.

Calculation: \( \frac{0.30\ \mu mol}{20\ s} = 0.015\ \mu mol/s \).

Completed Table 7.1 with calculated rate

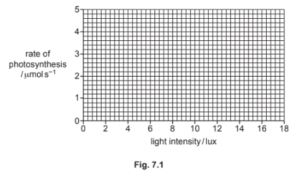
(a)(ii) Graph features:

  • Points plotted correctly for 0, 3, 6, 9, and 12 lux.
  • Curve rises steeply initially, then plateaus after 12 lux.
  • Extension to 18 lux shows a flattened curve (plateau).

Example plot: (Note: Actual plotting would show exact values from Table 7.1)

(a)(iii) The curve plateaus because:

  1. Light ceases to be limiting beyond 12 lux.
  2. Other factors become limiting: Temperature (fixed at 20°C) or CO₂ concentration.

(b) ATP synthesis via photoactivation:

  1. Photoexcitation: Chlorophyll in PSII absorbs light, exciting electrons to a higher energy level.
  2. Electron transport: Excited electrons move through the ETC, releasing energy.
  3. Proton pumping: Energy is used to pump H⁺ into the thylakoid lumen, creating a gradient.
  4. Chemiosmosis: H⁺ diffuses back via ATP synthase, driving ATP formation from ADP + Pi.

Key point: This is an example of the light-dependent reactions in the thylakoid membrane.

Scroll to Top