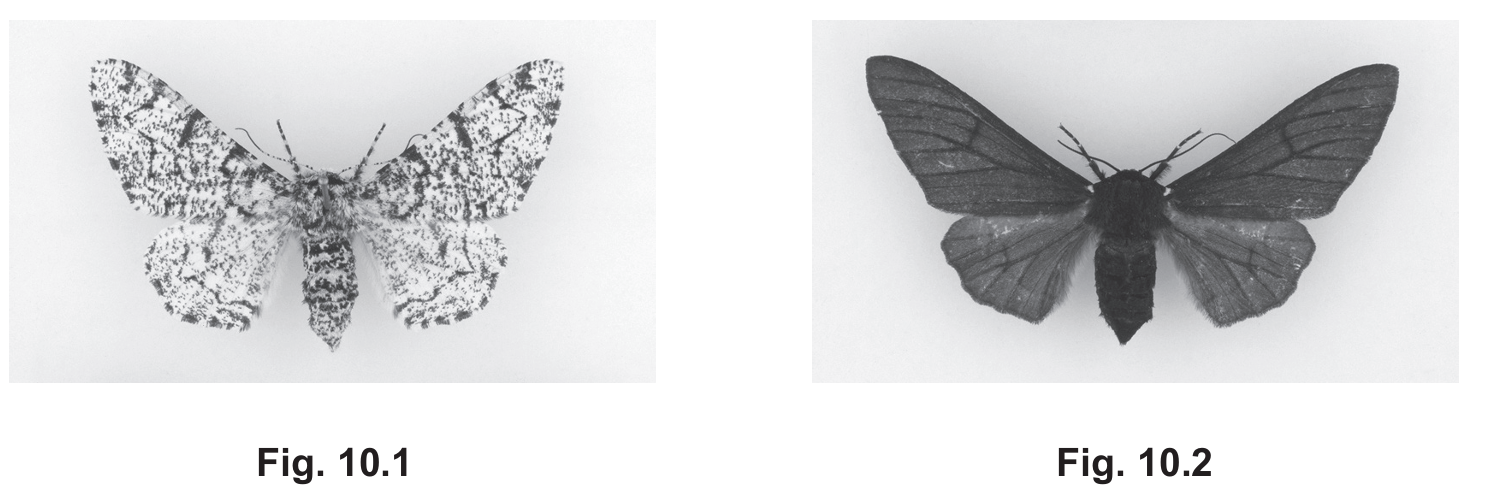
Populations of the moth Biston betularia live in Europe and in North America. The most common phenotype on both continents is a pale wing color with light-grey shading (the typical form).
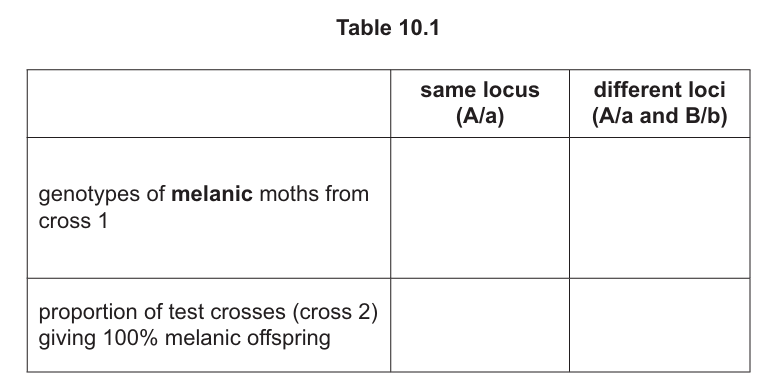
A moth phenotype with dark wing color (the melanic form) also occurs on both continents.
Fig. 10.1 shows the typical form of the moth.
Fig. 10.2 shows the melanic form of the moth.
(a) Two melanic European moths were crossed together. The wing colors of the offspring were 15 typical and 41 melanic.
Construct a genetic diagram to explain these results. You may use the symbols A and a to represent the alleles.
(b) In a similar experiment, two melanic North American moths were crossed together. The colors of the offspring were 10 typical and 31 melanic.
What can be concluded about the allele that causes the melanic form in the moth populations in both continents?
(c) Researchers did not know if the allele causing the melanic form in European moths occurred at the same locus as the allele causing the melanic form in North American moths. To find out, they carried out the following crosses:
- Cross 1: European moths that were heterozygous at the European melanic locus only were crossed with North American moths that were heterozygous at the North American melanic locus only.
- Cross 2: The melanic and the typical offspring of cross 1 were mated together.
(i) Explain why cross 2 is a test cross.
(ii) Complete Table 10.1 to show the predicted results if:
- the European and North American melanic alleles are on the same locus (A/a)
- the European and North American melanic alleles are on two different loci (A/a and B/b).
(d) A light trap was used to estimate the total size of a population of B. betularia in a woodland. On night one, 24 moths were captured. These were marked with a small spot of harmless paint. On night two, 29 moths were captured, and 8 of these showed a spot of paint.
Use the Lincoln index formula provided to calculate the size of the population.
Show your working.
\[N = \frac{n_1 \times n_2}{m_2}\]
Key to symbols:
\( N \) = estimate of population size
\( n_1 \) = number of individuals captured in first sample
\( n_2 \) = number of individuals (both marked and unmarked) captured in second sample
\( m_2 \) = number of marked individuals recaptured in second sample
▶️ Answer/Explanation
(a)
Genetic diagram:
(melanic × melanic)
Aa × Aa
(Gametes) A a and A a
(Offspring) AA Aa Aa aa
(melanic, melanic, melanic, typical)
(Ratio) 3 melanic : 1 typical
Explanation: The 3:1 ratio in the offspring indicates that the melanic form is dominant (A) and the typical form is recessive (a). The parents must both be heterozygous (Aa) to produce this ratio. The observed numbers (41 melanic:15 typical) approximate this 3:1 ratio, confirming Mendelian inheritance patterns.
(b)
The allele for melanic form is dominant in both populations.
Explanation: The similar ratio of approximately 3:1 (melanic:typical) in both European and North American populations strongly suggests that the melanic form is controlled by a dominant allele in both cases. This consistency across geographically separated populations indicates the same genetic mechanism is at work.
(c)(i)
Cross 2 is a test cross because the melanic/dominant phenotype is crossed with homozygous recessive.
Explanation: A test cross is used to determine the genotype of an organism with a dominant phenotype by crossing it with a homozygous recessive individual. In this case, crossing the melanic offspring with typical (recessive) moths will reveal whether the melanic moths are homozygous dominant or heterozygous.
(c)(ii)
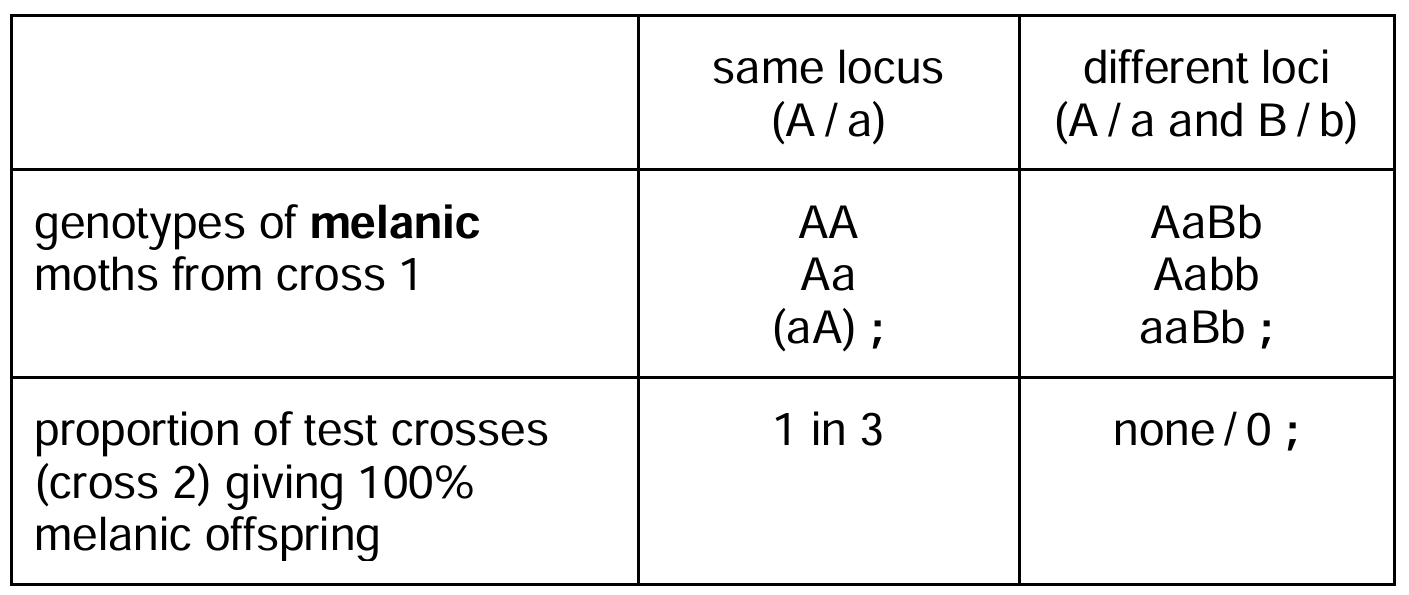
Explanation: If the alleles are at the same locus, some crosses (AA × aa) will produce all melanic offspring. If they’re at different loci, no crosses will produce all melanic offspring because at least some offspring will inherit the recessive alleles from both loci.
(d)
Calculation:
\[N = \frac{24 \times 29}{8}\]
\[= \frac{696}{8}\]
\[= 87\]
Explanation: The Lincoln index estimates population size using mark-recapture data. We mark 24 moths initially (n₁), then capture 29 later (n₂), finding 8 marked ones (m₂). The formula estimates total population (N) by assuming the proportion of marked moths in the second sample reflects their proportion in the whole population. This gives us an estimate of 87 moths in the woodland population.