The electron micrograph shows a longitudinal section through a blood vessel.
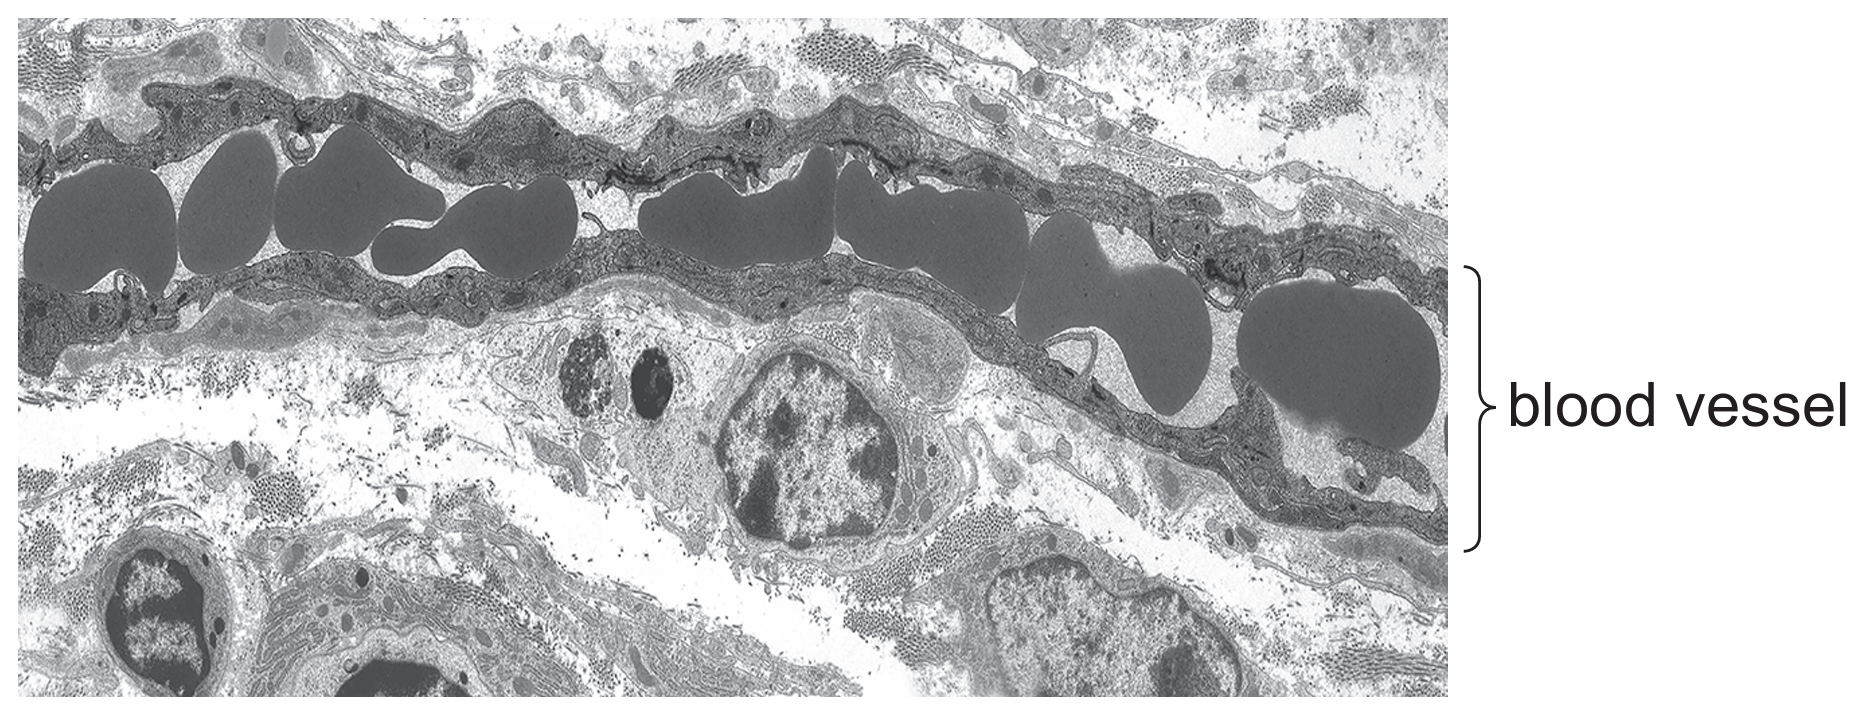
Which type of blood vessel is shown?
▶️ Answer/Explanation
Ans: B
The question refers to an electron micrograph (not shown here) of a blood vessel. Capillaries are identifiable by their single endothelial cell layer thickness (one cell thick), which allows for efficient gas exchange. Arterioles (A) and venules (D) have thicker walls, while veins (C) have valves.
The graph shows the effect of different partial pressures of carbon dioxide (CO2) on the oxygen dissociation curve for haemoglobin.
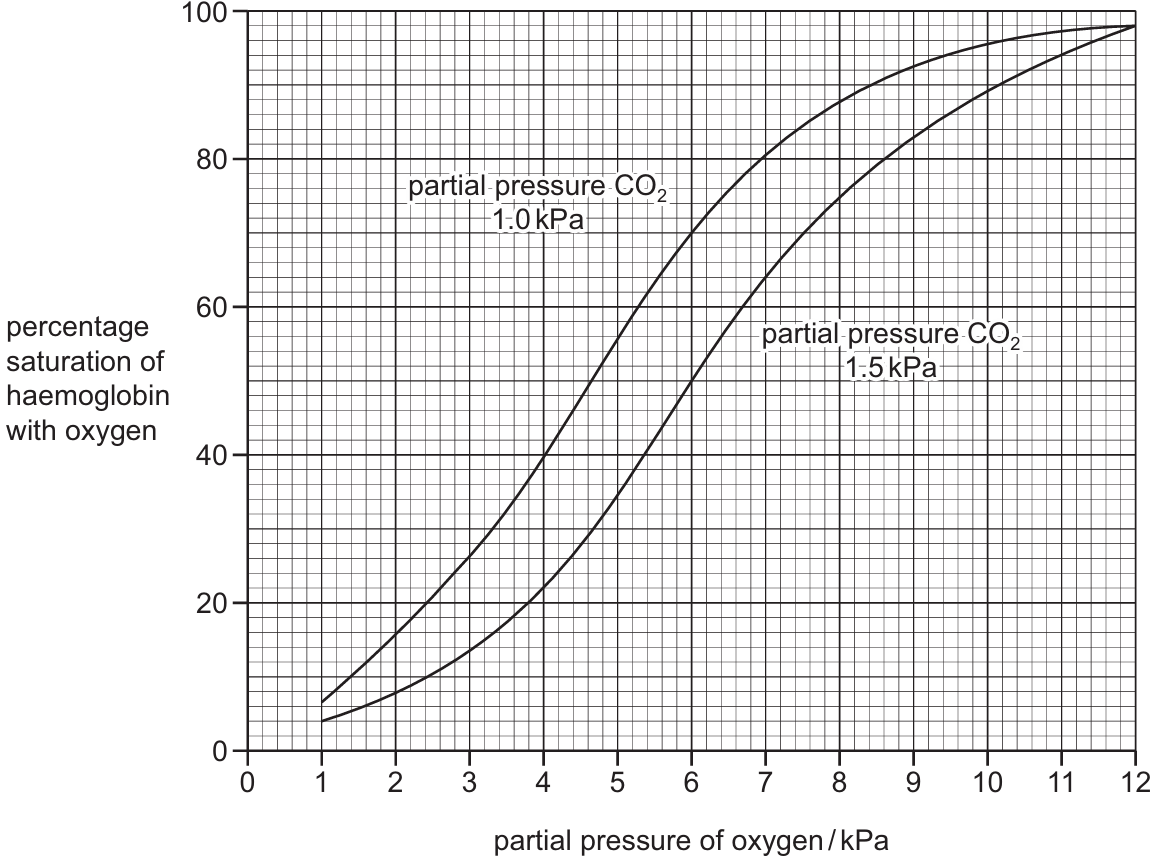
What is the change in percentage oxygen saturation of haemoglobin at a partial pressure of oxygen of 6 kPa as the partial pressure of carbon dioxide changes from 1.0 kPa to 1.5 kPa?
▶️ Answer/Explanation
Ans: B
At 6 kPa O2: 1.0 kPa CO2 gives ~76% saturation, 1.5 kPa CO2 gives ~56% saturation. The change is 56-76 = -20%. This demonstrates the Bohr effect – increased CO2 reduces haemoglobin’s oxygen affinity, promoting oxygen unloading in active tissues.
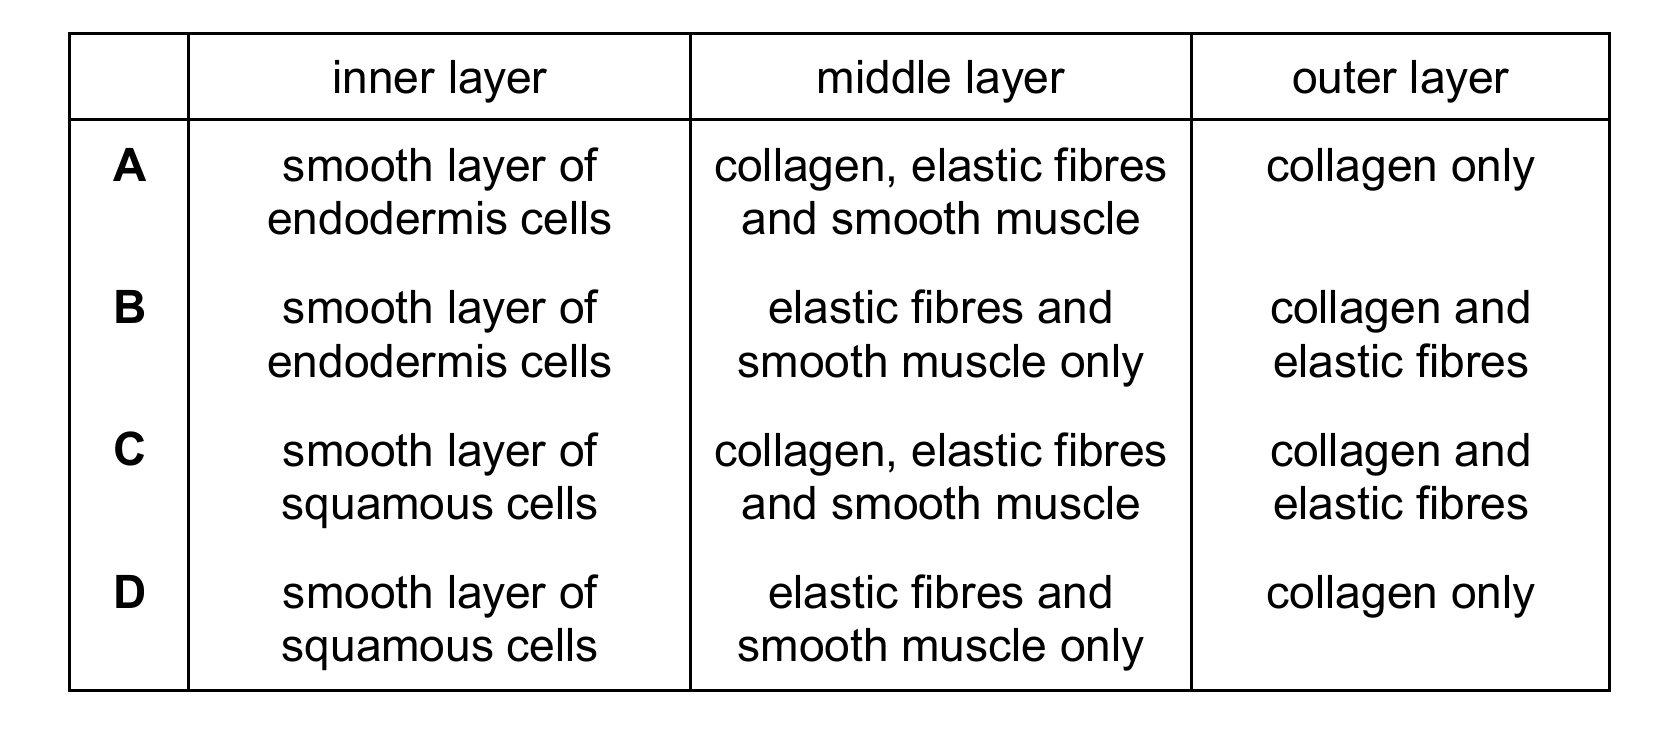
Which row is correct for an artery?
▶️ Answer/Explanation
Ans: C
Artery walls have three layers: 1) Inner endothelium (squamous cells, not endodermis), 2) Middle layer with smooth muscle, elastic fibers and collagen, and 3) Outer layer with collagen and elastic fibers. Only option C correctly describes all three layers with the proper components in each.
The graph shows how the volume of the left ventricle changes during one cardiac cycle.
Which point on the graph represents the start of atrial systole?
▶️ Answer/Explanation
Ans: C
Atrial systole begins at point C, where the ventricle volume increases sharply as the atria contract, forcing blood into the ventricle. Points A/B/D represent other phases (e.g., isovolumetric contraction or ejection). The graph’s rise at C indicates filling due to atrial contraction.