Effects of Limiting Factors on Photosynthesis
📌 Overview
- The rate of photosynthesis depends on light intensity, CO₂ concentration, and temperature.
- Each factor can limit photosynthesis if it is too low or, in some cases, too high.
🌱 1. Light Intensity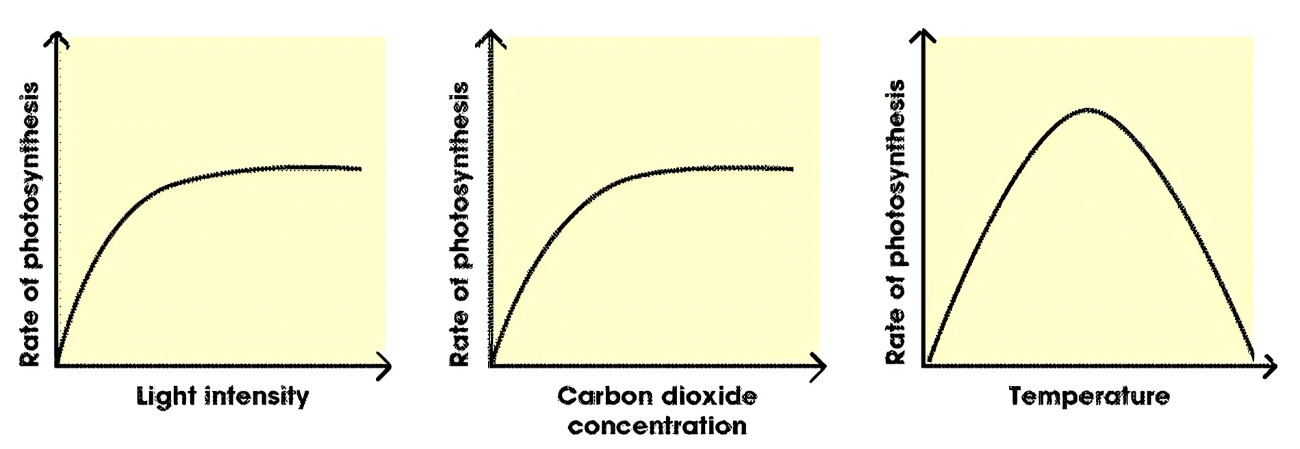
- Low light: Rate of light-dependent reactions is slow → less ATP and NADPH → slower Calvin cycle.
- Increasing light intensity: Rate increases until another factor becomes limiting (e.g., CO₂ or temperature).
- Very high light: Can damage chlorophyll or photosystems → rate may plateau or decline.
🌱 2. Carbon Dioxide Concentration
- Low CO₂: Calvin cycle slows → less GP → less TP → reduced sugar synthesis.
- Increasing CO₂: Rate increases until another factor (light or temperature) becomes limiting.
- Very high CO₂: Can cause a slight inhibitory effect due to stomatal closure in some plants.
🌱 3. Temperature
- Low temperature: Enzymes in the Calvin cycle work slowly → reduced photosynthesis rate.
- Optimal temperature: Enzymes work efficiently → maximum rate of photosynthesis.
- High temperature: Enzymes may denature → photosynthesis rate drops sharply. Stomata may close → CO₂ uptake decreases.
🧠 Key Points
– Each factor has an optimum range for maximum photosynthesis.
– Limiting factor principle: The factor in shortest supply determines the rate.
– In nature, light, CO₂, and temperature interact to influence photosynthesis.
Investigating Photosynthesis Using Redox Indicators
📌 Overview
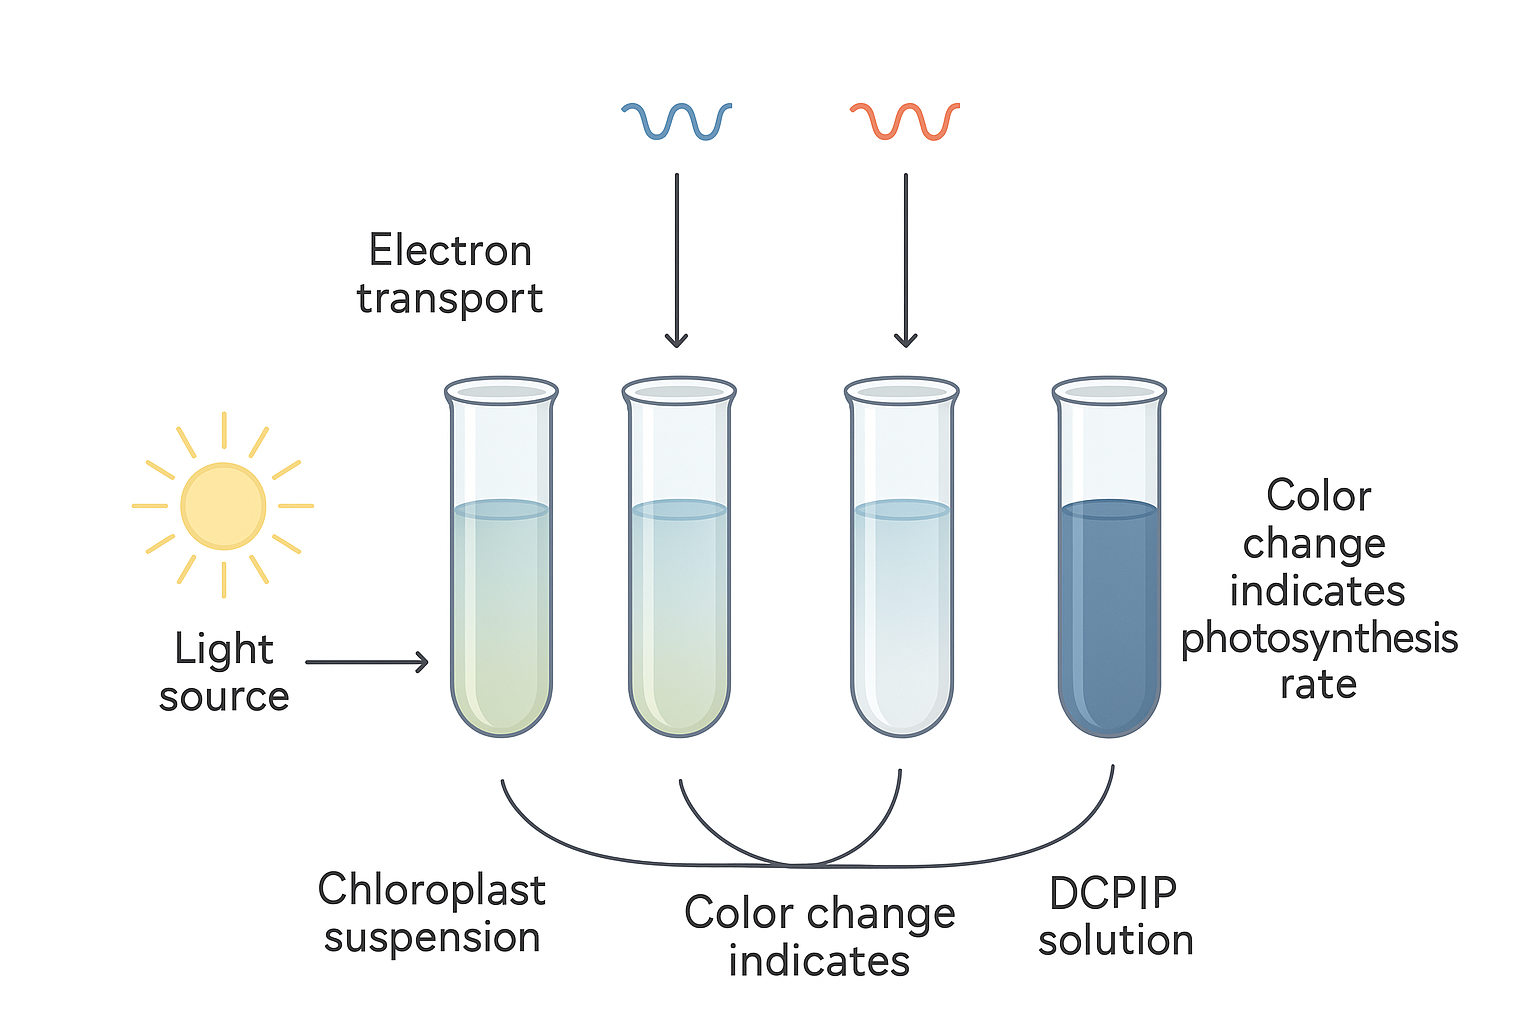
- Redox indicators (e.g., DCPIP, methylene blue) are used to monitor electron transfer in the light-dependent reactions of photosynthesis.
- Chloroplast suspensions provide the site for the reactions in vitro.
- Experiments can determine how light intensity and wavelength affect the rate of photosynthesis.
🌱 Principle
- DCPIP (2,6-dichlorophenol-indophenol) is blue when oxidized and colorless when reduced.
- Methylene blue is blue when oxidized and colorless when reduced.
- During light-dependent photosynthesis:
- Electrons from water reduce DCPIP or methylene blue, causing a color change.
- The rate of color change indicates the rate of electron transport → proxy for photosynthesis rate.
 🌱 Method (Example Using DCPIP)
- Isolate a chloroplast suspension from fresh leaves.
- Mix chloroplasts with DCPIP solution in a test tube.
- Expose the mixture to light of different intensities or wavelengths.
- Include control tubes:
- Dark (no light) → ensures color change is light-dependent.
- Measure the time for DCPIP to decolorize or use a colorimeter to monitor absorbance.
- Compare rates under different light conditions.
🌱 Observations
| Condition | Result (DCPIP) | Interpretation |
|---|---|---|
| Light present | DCPIP turns colorless faster | Electron transport is active → high photosynthesis rate |
| Light absent (dark) | DCPIP remains blue | No electron transport → no photosynthesis |
| Different wavelengths | Blue and red light → faster decolorization; Green light → slower | Chlorophyll absorbs mainly blue and red light |
🧠 Key Points
– Redox indicators act as artificial electron acceptors, replacing NADP⁺.
– The rate of decolorization reflects the rate of light-dependent photosynthesis.
– Helps investigate: effect of light intensity (stronger light → faster reaction) and wavelength (blue/red → most effective).
Investigating Photosynthesis Using Whole Plants
📌 Overview
- Whole plants (terrestrial or aquatic) can be used to study how environmental factors affect photosynthesis.
- The rate of photosynthesis can be measured by observing O₂ production or CO₂ uptake.
🌱 Principle
- Photosynthesis produces oxygen as a by-product.
- Measuring bubbles of O₂ in aquatic plants (e.g., Elodea) or using gas sensors provides an estimate of the photosynthesis rate.
- Changes in light intensity, CO₂ concentration, or temperature affect the rate of photosynthesis.
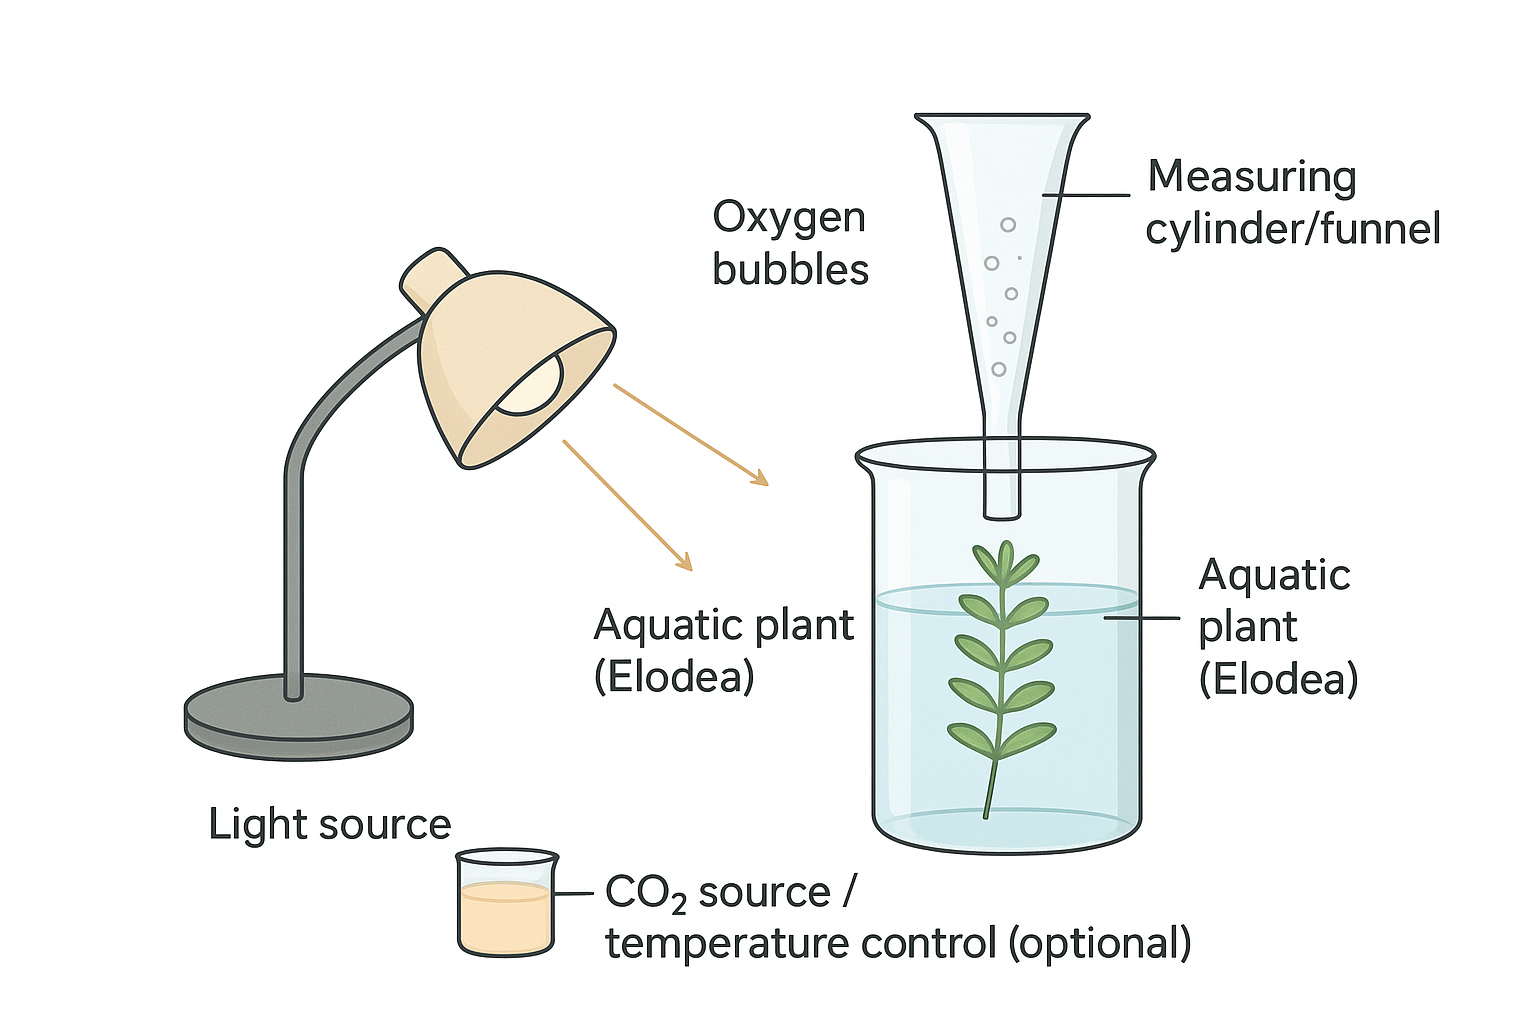
🌱 Method (Example Using Aquatic Plant)
- Set up: Place an aquatic plant (e.g., Elodea) in a test tube or beaker with water. Invert a measuring cylinder or funnel to collect oxygen bubbles.
- Control variables: Same volume of water, same plant size, same initial conditions.
- Manipulate independent variable:
- Light intensity: Move lamp closer/further.
- CO₂ concentration: Add sodium bicarbonate to water.
- Temperature: Use water baths at different temperatures.
- Observation: Count the number of oxygen bubbles per minute. Repeat for accuracy.
- Record data: Plot rate of photosynthesis vs light intensity / CO₂ / temperature.
🌱 Expected Results
| Factor | Effect on Photosynthesis Rate |
|---|---|
| Light intensity | Rate increases with light until another factor becomes limiting |
| CO₂ concentration | Rate increases with CO₂ until light or temperature limits |
| Temperature | Rate increases with temperature up to optimum; high temperature → enzymes denature → rate drops |
🧠 Key Points
– O₂ production is a simple, measurable indicator of photosynthesis.
– Each factor has an optimum range; too low or too high can limit the rate.
– Helps understand plant adaptation and environmental responses.