Phenotypic Variation
🧬What is Phenotypic Variation?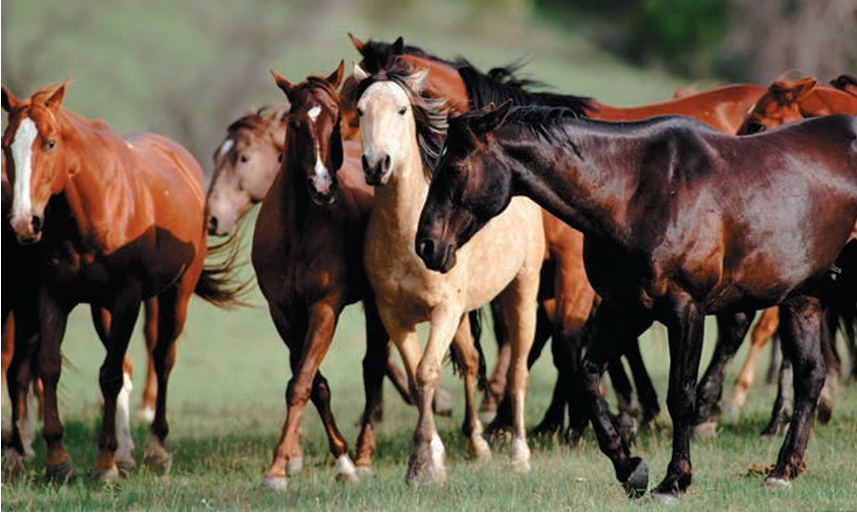
- Phenotype = observable characteristics of an organism.
- Variation = differences in phenotype between individuals.
- Caused by:
- Genetic factors
- Environmental factors
- Combination of both
1. Genetic Factors
- Controlled by differences in genes/alleles.
- Passed from parent to offspring.
- Examples:
- Flower colour in pea plants → controlled by a single gene.
- Blood group in humans (A, B, AB, O) → determined by multiple alleles of the ABO gene.
- Sickle-cell anaemia → caused by mutation in the HBB gene.
2. Environmental Factors
- Caused by conditions in the organism’s surroundings, not genes.
- Not inherited.
- Examples:
- Soil pH affecting flower colour in hydrangeas (blue in acidic soil, pink in alkaline soil).
- Sunlight exposure affecting skin colour (tanning).
- Diet affecting body mass.
3. Combination of Genetic and Environmental Factors
- Most characteristics are influenced by both genes and environment.
- Examples:
- Height in humans → genetic potential, but nutrition affects final height.
- Skin colour → genetic base, but sunlight can darken skin (tanning).
- Milk yield in cows → genetic makeup sets potential, but diet and management affect actual yield.
✅ Summary:
Phenotypic variation can be:
Phenotypic variation can be:
- Genetic only (e.g., blood group),
- Environmental only (e.g., tanning), or
- Combination of both (e.g., height, milk yield).
Types of Variation
Discontinuous Variation 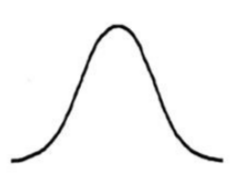
- Definition: Variation where individuals fall into distinct categories with no intermediates.
- Controlled by: Usually a single gene (monogenic).
- Not influenced much by environment.
- Data type: Qualitative (non-numerical).
- Examples:
- Blood group in humans (A, B, AB, O)
- Sex in humans (male/female)
- Flower colour in pea plants (purple or white)
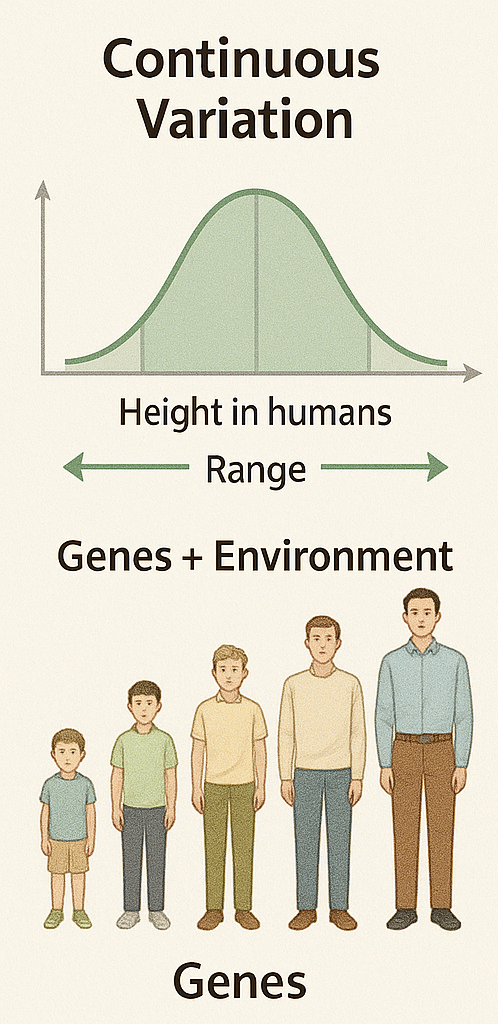
Continuous Variation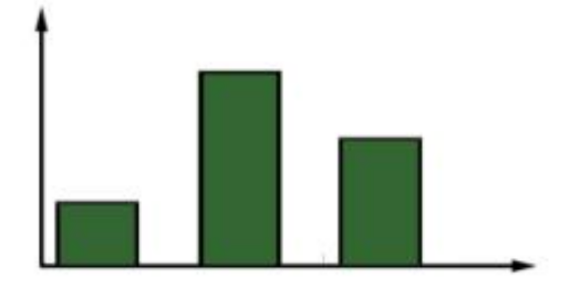
- Definition: Variation where individuals show a range of values between two extremes, with intermediates.
- Controlled by: Many genes (polygenic inheritance).
- Strongly influenced by environment.
- Data type: Quantitative (measured in numbers).
- Examples:
- Human height
- Human body mass
- Milk yield in cows
- Grain size in wheat
✅ Key Difference:
- Discontinuous = either/or categories, controlled by one gene, little environmental effect.
- Continuous = measurable range, controlled by many genes, strongly affected by environment.
Genetic Basis of Variation
🌸 Discontinuous Variation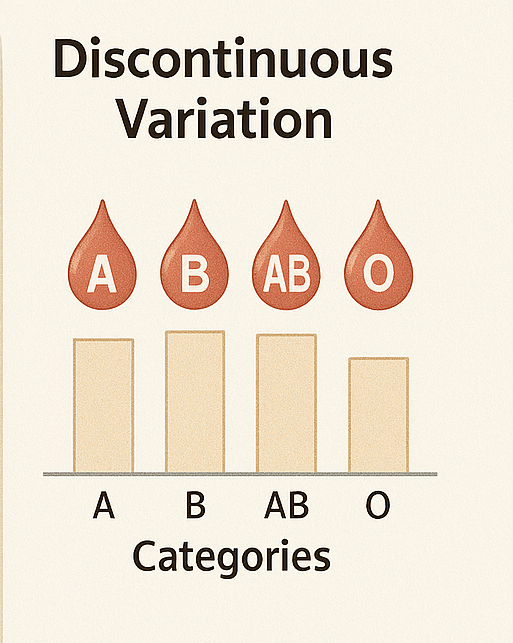
- Genetic Control: Usually controlled by a single gene (monogenic).
- Alleles: Different alleles of a gene produce distinct phenotypes.
- Effect of Environment: Minimal; phenotype is largely determined by genotype.
- Examples:
- Blood group in humans (A, B, AB, O)
- Flower colour in pea plants (purple or white)
- Presence or absence of a particular trait (e.g., earlobe attachment)
🌿 Continuous Variation
- Genetic Control: Controlled by many genes (polygenic inheritance).
- Alleles: Multiple genes contribute additively to the trait.
- Effect of Environment: Strong influence; environmental factors modify the phenotype.
- Examples:
- Human height and weight
- Skin colour in humans
- Milk yield in cows
📊 Key Points
- Discontinuous variation: single gene → distinct categories → minimal environmental influence.
- Continuous variation: multiple genes → wide range of phenotypes → strongly affected by environment.