Ecosystem and Niche
🌱 1. Ecosystem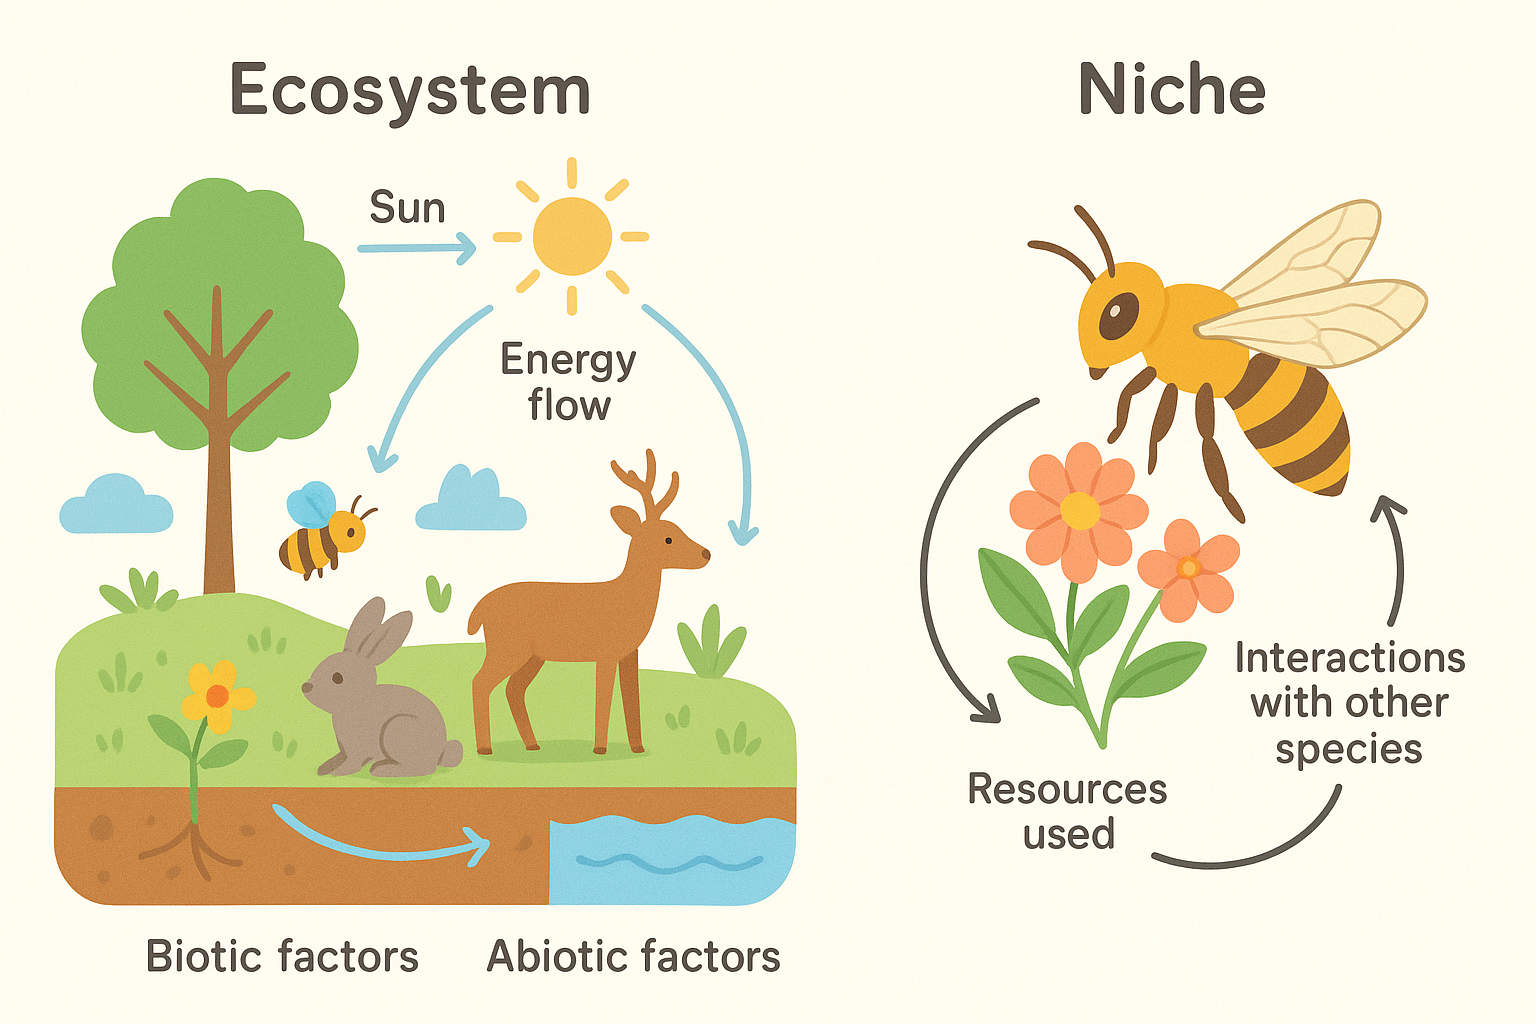
- Definition: An ecosystem is a community of living organisms (biotic factors) interacting with each other and their physical environment (abiotic factors) in a specific area.
- Key Idea: Includes energy flow and nutrient cycling.
- Example: A pond, rainforest, desert.
🌿 2. Niche
- Definition: A niche is the role or function of a species within its ecosystem, including how it obtains food, interacts with other species, and survives.
- Key Idea: Two species cannot occupy the exact same niche in the same habitat (competitive exclusion principle).
- Example: Bees pollinating flowers, wolves hunting herbivores.
📌 Key Points
| Term | Definition | Example |
|---|---|---|
| Ecosystem | Community of organisms + environment | Pond ecosystem |
| Niche | Role/function of a species in ecosystem | Bee pollination role |
Biodiversity Assessment
🌱 Key Concept
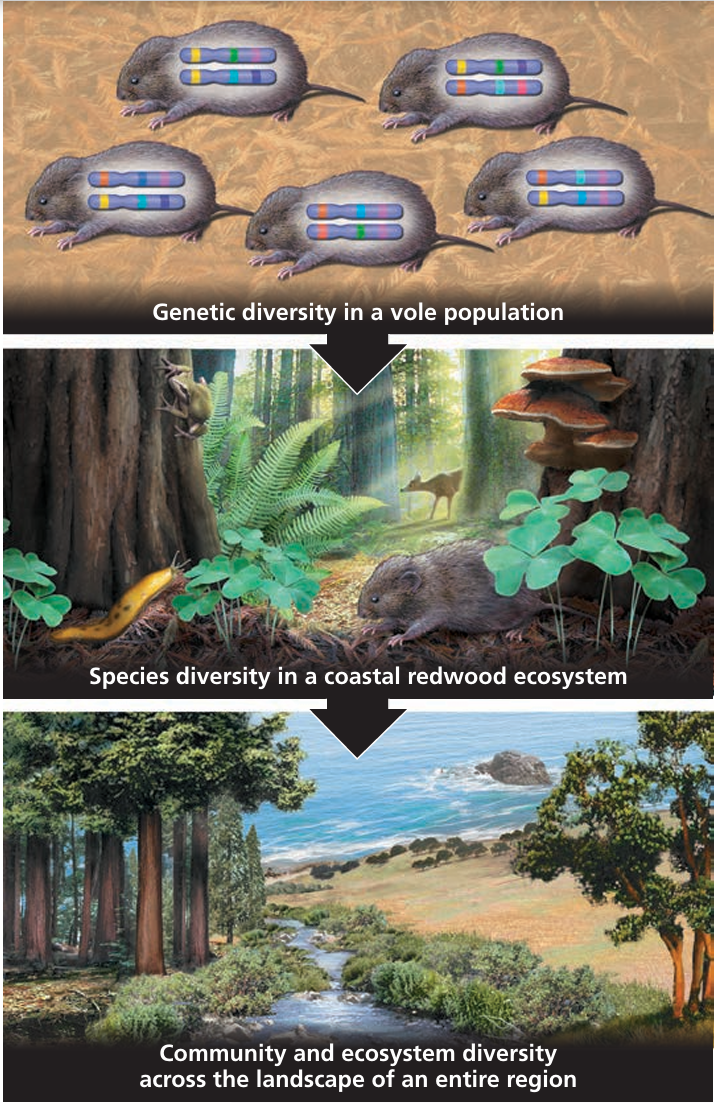
- Biodiversity is the variety of life at all levels of biological organization.
 It can be assessed at different levels: ecosystem, species, and genetic.
 It can be assessed at different levels: ecosystem, species, and genetic.
1. Ecosystem and Habitat Diversity
- Definition: Variety of ecosystems or habitats in a given area.
- Assessment: Count the number of distinct ecosystems and range of habitats.
- Example: Forests, wetlands, coral reefs, grasslands.
2. Species Diversity
- Definition: Variety of species in an ecosystem.
- Assessment:
- Species richness: Number of species present.
- Relative abundance: How common or rare each species is.
- Example: A rainforest with 200 bird species vs. a desert with 20 bird species.
3. Genetic Diversity
- Definition: Variation of alleles within a species.
- Importance:
- Ensures adaptation to changing environments.
- Reduces risk of disease or extinction.
- Example: Different breeds of dogs or varieties of wheat.
📌 Key Points
| Level | What is Assessed | Example |
|---|---|---|
| Ecosystem/Habitat | Number and range of ecosystems | Forest, desert, wetland |
| Species | Number of species + relative abundance | 200 vs 20 bird species |
| Genetic | Variation within species | Dog breeds, wheat varieties |
Assessing Distribution and Abundance of Organisms
🌱 Key Concept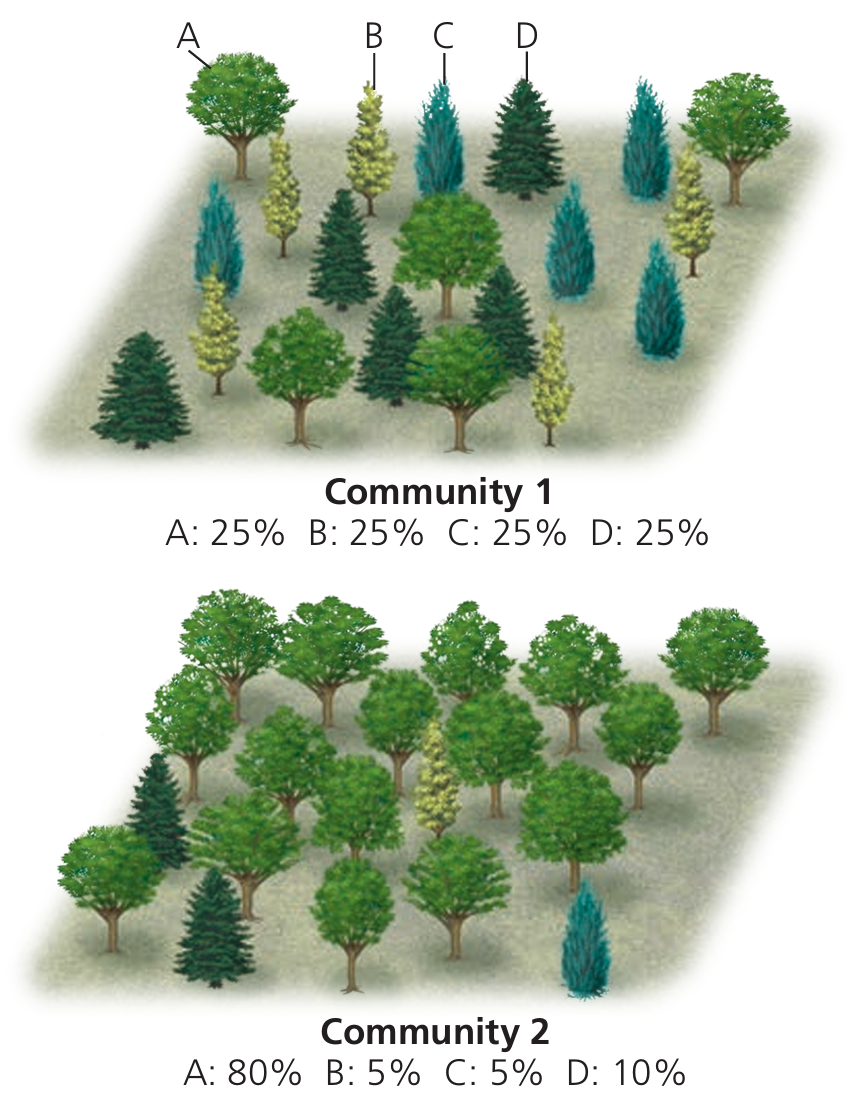
- Distribution: Where organisms are found in an area.
- Abundance: Number of individuals of a species in a given area.
- Methods: Use sampling techniques to estimate these reliably.
1. Frame Quadrats
- Use: To study plants or slow-moving organisms in a small area.
- Method:
- Place a square or rectangular frame randomly.
- Count the number of individuals or estimate percentage cover.
- Repeat in multiple random locations.
- Output: Species abundance, frequency, and distribution patterns.
2. Line Transects
- Use: To study how organisms are distributed along a line (e.g., gradient, shorelines).
- Method:
- Stretch a rope or tape along the area.
- Record every organism touching the line at regular intervals.
- Output: Shows distribution along a gradient.
3. Belt Transects
- Use: To study distribution and abundance along a strip.
- Method:
- Combine line transect and quadrats.
- Place quadrats adjacent to each other along the line.
- Count all organisms in each quadrat.
- Output: More detailed than line transect; shows density and distribution.
4. Mark-Release-Recapture (Lincoln Index)
- Use: To estimate the population size of mobile animals.
- Method:
- Capture a sample of animals, mark them harmlessly, and release.
- After some time, recapture a sample.
- Count how many are marked and unmarked.
- Population Estimate Formula (Lincoln Index):
- N = (n₁ × n₂) / n₃
- N = total population size
- n₁ = number of individuals marked in first sample
- n₂ = total number captured in second sample
- n₃ = number of marked individuals recaptured
📌 Key Points
| Method | Best For | What it Measures |
|---|---|---|
| Frame Quadrats | Plants, slow organisms | Abundance, distribution, % cover |
| Line Transect | Gradient studies | Distribution along a line |
| Belt Transect | Gradient studies | Detailed density & distribution |
| Mark–Release–Recapture | Mobile animals | Population size estimation |
Analysing Relationships Between Variables
🌱 Key Concept
- Correlation measures how two variables are related.
- In ecology, it helps determine how biotic or abiotic factors affect species distribution and abundance.
1. Spearman’s Rank Correlation![]()
- Use: For ordinal or non-normally distributed data.
- Purpose: Measures the strength and direction of a monotonic relationship.
- Interpretation:
- rs = +1 → perfect positive correlation
- rs = −1 → perfect negative correlation
- rs = 0 → no correlation
- Example: Relationship between soil pH ranking and plant species richness.
2. Pearson’s Linear Correlation
- Use: For interval or ratio data that are normally distributed.
- Purpose: Measures strength and direction of a linear relationship.
- Interpretation:
- r = +1 → perfect positive linear correlation
- r = −1 → perfect negative linear correlation
- r = 0 → no linear correlation
- Example: Relationship between light intensity (lux) and rate of photosynthesis.
🌿 Applications in Ecology
- Abiotic factors: Temperature, light, soil pH, salinity.
- Biotic factors: Competition, predation, mutualism.
- Use correlation to:
- Predict how environmental changes affect species.
- Identify limiting factors in ecosystems.
📌 Key Points
| Method | Data Type | Use | Example |
|---|---|---|---|
| Spearman’s Rank | Ordinal/non-normal | Monotonic relationships | Soil pH rank vs plant diversity |
| Pearson’s Linear | Interval/ratio | Linear relationships | Light intensity vs photosynthesis rate |
Correlation does not imply causation – it only shows association between variables.