Investigating Simple Diffusion & Osmosis
🌱 1. Key Concepts
- Diffusion: Movement of particles from a region of higher concentration to lower concentration due to random molecular motion.
- Osmosis: Movement of water molecules through a selectively permeable membrane from a region of higher water potential to a region of lower water potential.
🧪 2. Osmosis Using Plant Tissue (Potato or Beetroot)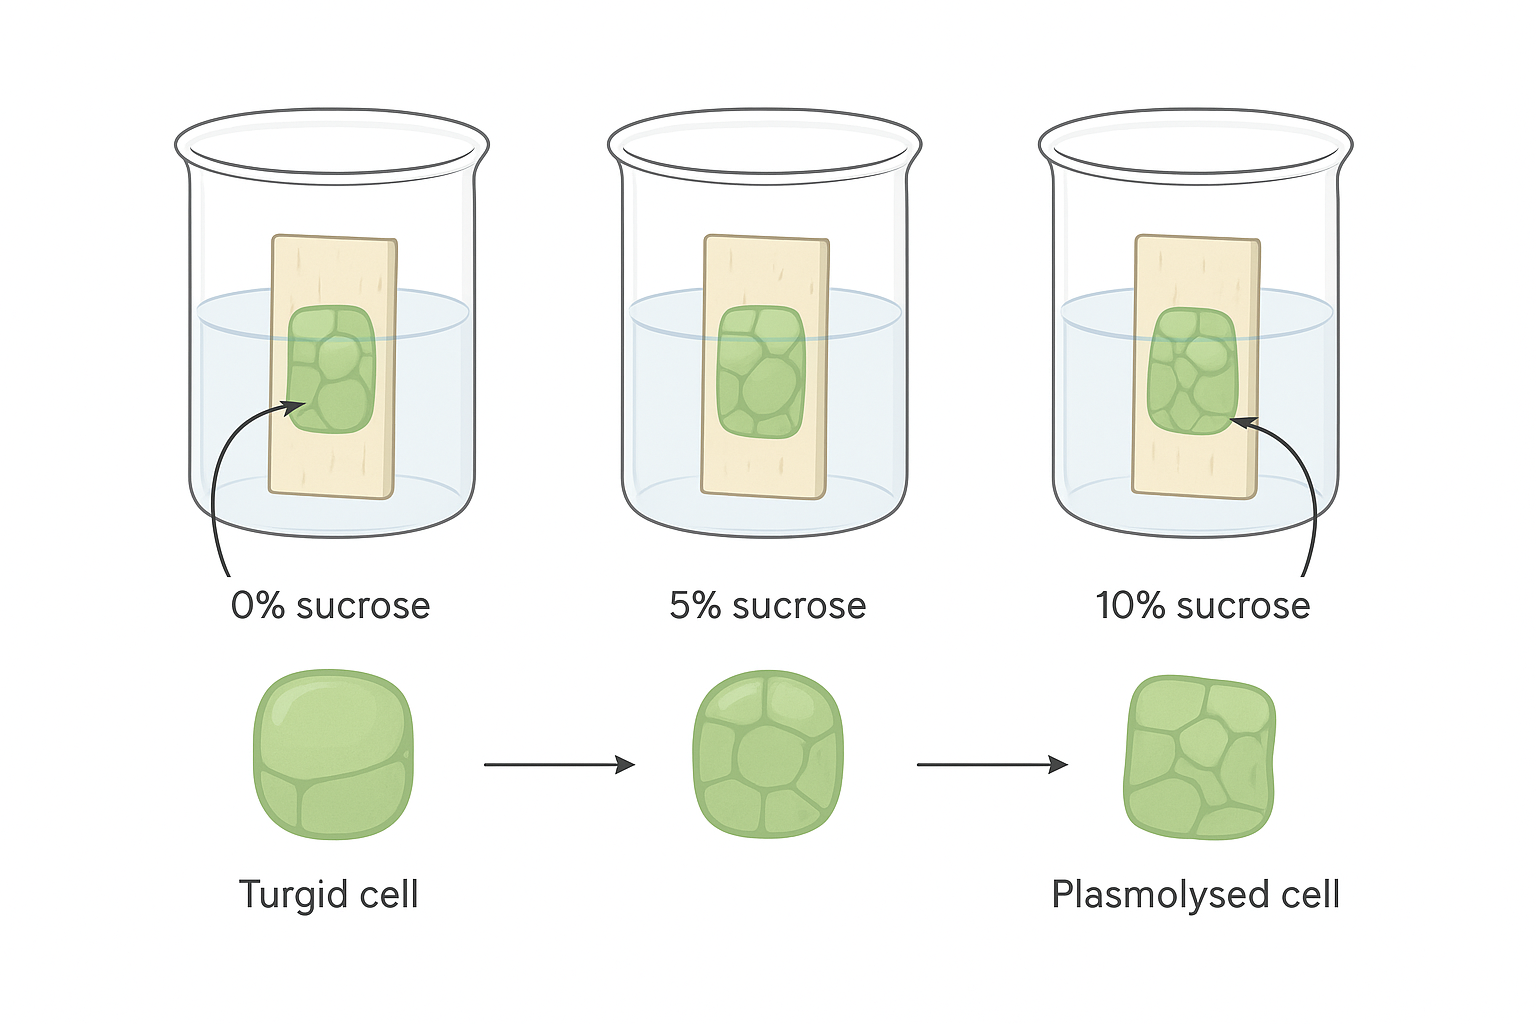
- Aim: Observe the effect of different solute concentrations on plant tissue.
- Materials: Potato/beetroot strips or cylinders, sucrose/salt solutions of various concentrations, distilled water, beakers, ruler, balance.
- Method:
- Cut equal-sized plant tissue samples.
- Record their initial length and/or mass.
- Place samples in different concentrations of solution (e.g., 0%, 5%, 10% sucrose).
- Leave for 30–60 minutes.
- Remove, blot dry, re-measure length/mass.
- Compare changes to determine water movement.
- Expected Results:
- Dilute solution: Tissue gains mass (water enters cells).
- Concentrated solution: Tissue loses mass (water leaves cells).
🧪 3. Osmosis Using Non-Living Material (Dialysis/Visking Tubing)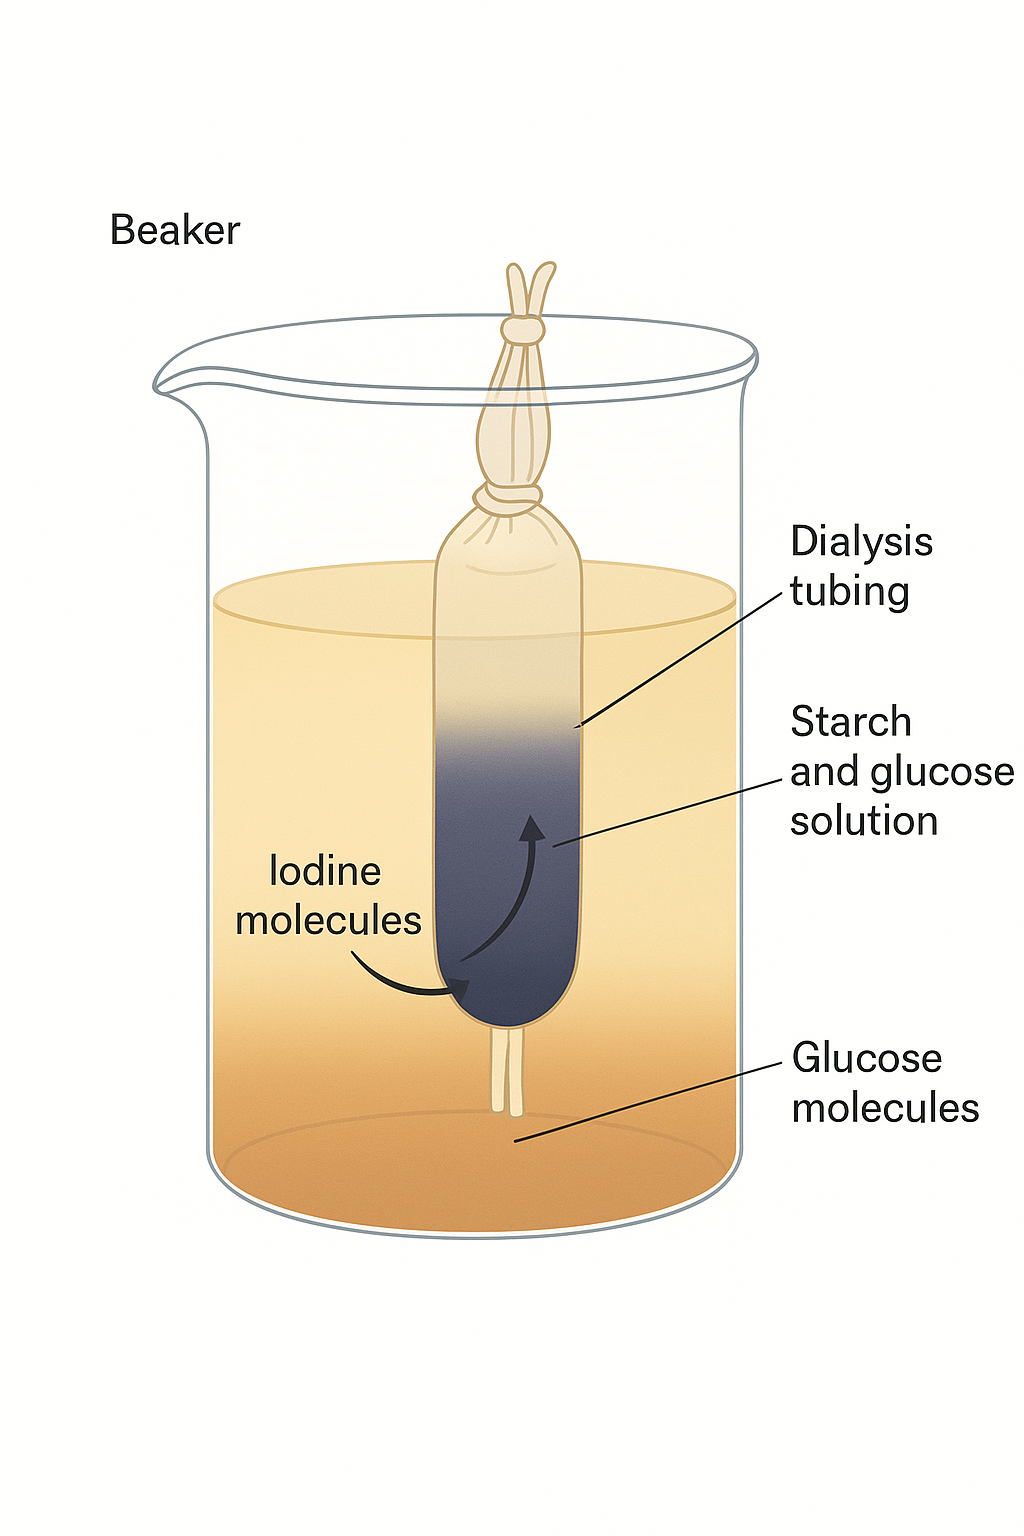
- Aim: Demonstrate selective permeability.
- Materials: Dialysis tubing, starch solution, glucose solution, water, iodine solution, Benedict’s reagent.
- Method:
- Fill tubing with starch + glucose solution, tie ends.
- Place in beaker of water + iodine.
- Leave for ~30 minutes.
- Test outside solution for glucose using Benedict’s test.
- Expected Results:
- Iodine enters tubing → starch turns blue-black.
- Glucose leaves tubing → detected outside using Benedict’s test.
🧪 4. Diffusion Using Agar Cubes
- Aim: Investigate effect of surface area to volume ratio on diffusion.
- Materials: Agar jelly with indicator (e.g., phenolphthalein), sodium hydroxide, hydrochloric acid, scalpel, ruler.
- Method:
- Cut agar into cubes of different sizes.
- Place cubes in dilute acid.
- Measure time for colour to disappear completely.
- Expected Results: Smaller cubes lose colour faster → higher SA:V ratio = faster diffusion.
📊 5. Summary Table
| Investigation | Material Used | Main Principle | Expected Outcome |
|---|---|---|---|
| Osmosis in plant tissue | Potato/Beetroot | Water movement depends on solution concentration | Mass/length changes |
| Osmosis in dialysis tubing | Visking tubing | Selective permeability | Small molecules pass, large molecules do not |
| Diffusion in agar cubes | Agar + indicator | Rate depends on SA:V ratio | Smaller cubes change colour faster |
🧠 Key Recap:
Diffusion = particles move from high to low concentration.
Osmosis = water moves through a selectively permeable membrane.
Plant tissue shows osmotic gain/loss of mass.
Dialysis tubing mimics selective permeability of cell membranes.
Smaller cells or cubes diffuse substances faster due to higher surface area-to-volume ratio.
Investigation: Effect of SA:V Ratio on Diffusion in Agar Blocks
🌱 Aim
- To investigate: How changing the surface area to volume (SA:V) ratio affects the rate of diffusion using agar blocks.
🧬 Background
- Diffusion: Movement of particles from high concentration to low concentration.
- SA:V effect: Higher SA:V → faster net exchange/penetration of substances; lower SA:V → slower penetration.
- Prediction: Smaller agar blocks (larger SA:V) will lose colour faster when placed in acid.
🧪 Materials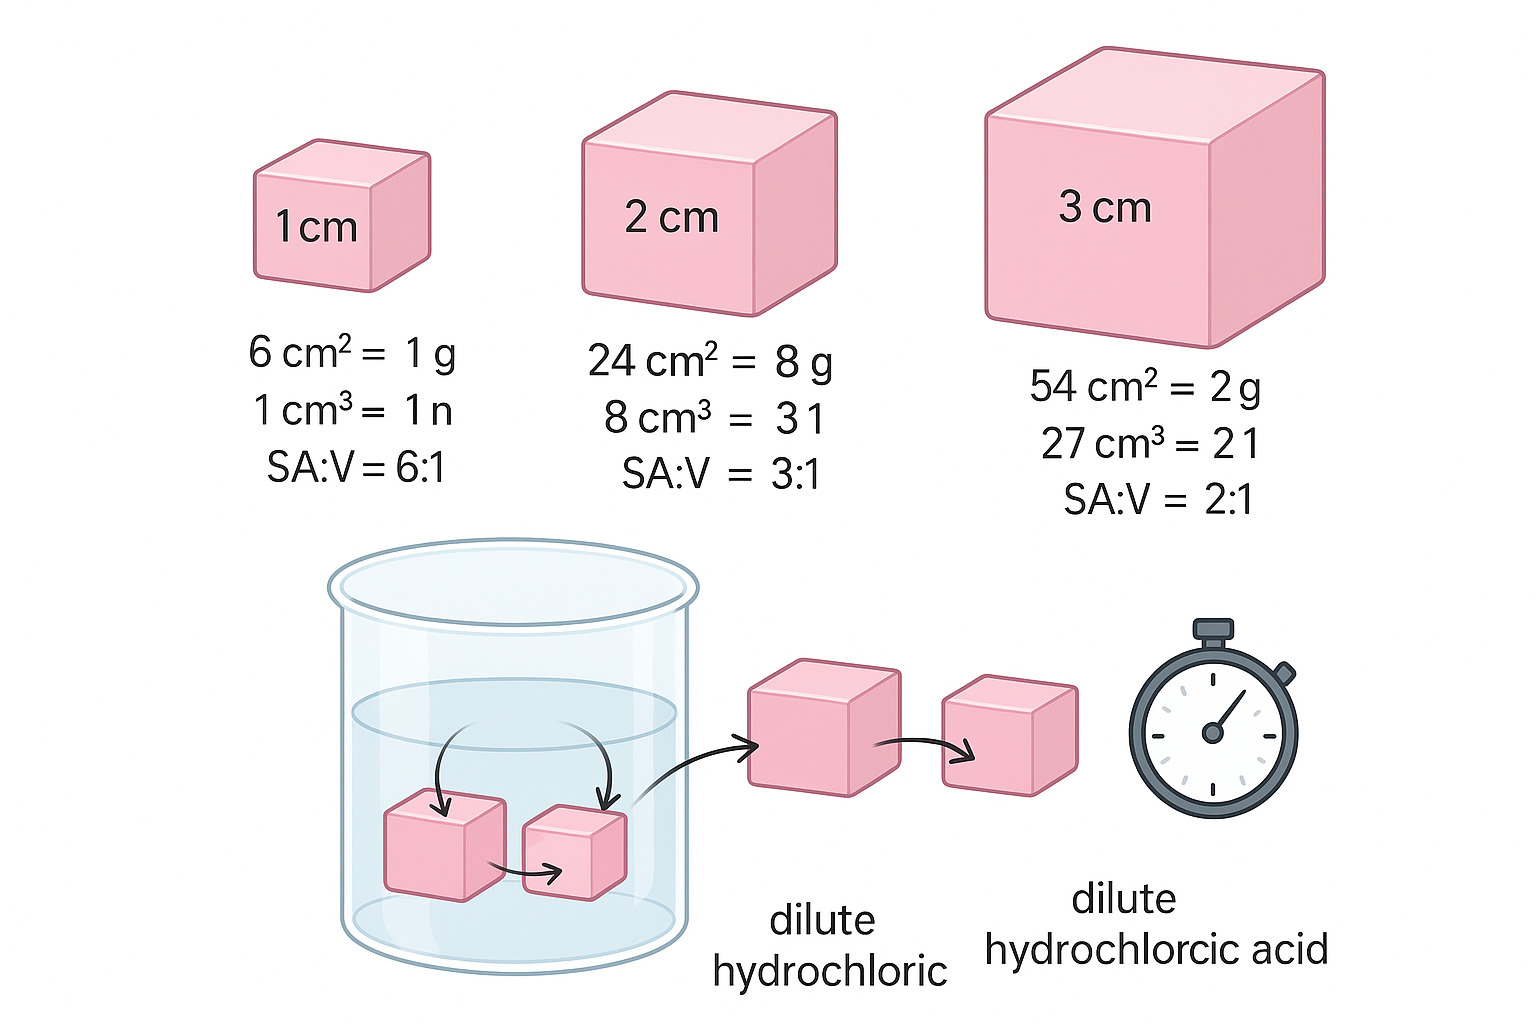
- Agar blocks containing a pH indicator (e.g., phenolphthalein)
- Beaker of dilute acid (e.g., 0.1 M HCl)
- Ruler
- Scalpel or knife
- Stopwatch
- Marker / labels
🔬 Method
- Prepare agar blocks of different cube sizes (e.g., side lengths 1 cm, 2 cm, 3 cm).
- Measure and record the dimensions of each block precisely.
- Calculate surface area (SA), volume (V), and SA:V ratio for each block.
- Place all blocks in the dilute HCl at the same time and start the stopwatch.
- Record the time taken for each block to become fully colourless (indicator neutralised).
- Repeat the experiment (at least 2–3 trials) and calculate mean times.
- Compare times against SA:V ratios and draw conclusions.
📊 Example Calculations (Cube-shaped blocks)
| Side Length (cm) | SA (cm²) | Volume (cm³) | SA:V Ratio | Time for Colour to Disappear (min) |
|---|---|---|---|---|
| 1 | 6 × (1²) = 6 | 1³ = 1 | 6 : 1 | 2.0 |
| 2 | 6 × (2²) = 24 | 2³ = 8 | 3 : 1 | 5.0 |
| 3 | 6 × (3²) = 54 | 3³ = 27 | 2 : 1 | 9.0 |
Observation: As SA:V decreases (blocks get larger), the time for the acid to diffuse and neutralise the indicator increases.
🧠 Conclusion
- Smaller agar blocks (higher SA:V) allow faster penetration of acid and quicker colour change.
- Larger blocks have proportionally less surface per unit volume, so diffusion takes longer to reach the centre.
- This supports why biological cells are small — high SA:V enables efficient exchange of substances required for metabolism.
📌 Key Points:
High SA:V → faster diffusion rate.
Large size → low SA:V → slower exchange.
Calculate SA:V to compare efficiency between different shapes/sizes.
Repeat trials and use mean times to improve reliability.
High SA:V → faster diffusion rate.
Large size → low SA:V → slower exchange.
Calculate SA:V to compare efficiency between different shapes/sizes.
Repeat trials and use mean times to improve reliability.
Investigation: Effect of Water Potential on Plant Tissue
Aim
- To investigate how plant tissue mass changes when immersed in solutions of different water potentials.
- To use results to estimate the tissue’s water potential.
🧬 Background Concepts
- Water potential (Ψ): Measure of the tendency of water to move from one region to another (kPa).
- Water moves from higher Ψ (less negative) → lower Ψ (more negative).
- Osmosis: Passive movement of water across a partially permeable membrane.
- Hypotonic solution: Water enters cells → cells become turgid.
- Hypertonic solution: Water leaves cells → cells become plasmolysed.
🧪 Materials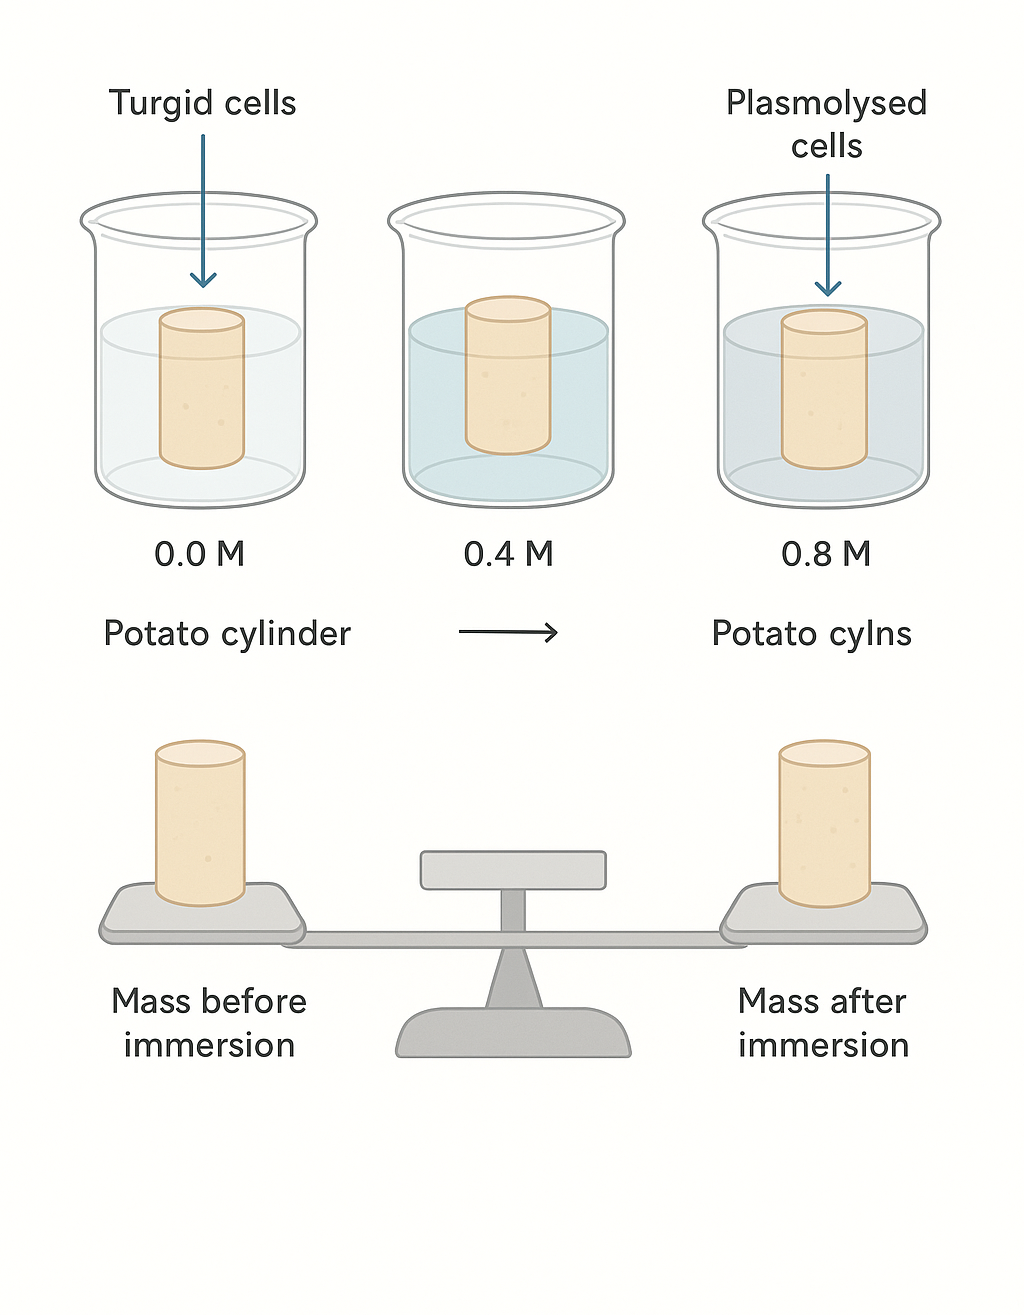
- Fresh potato or beetroot cylinders (equal size)
- Cork borer or scalpel
- Distilled water
- Sucrose solutions of known concentrations (0.0 M, 0.2 M, 0.4 M, 0.6 M, 0.8 M)
- Beakers/test tubes
- Balance (0.01 g accuracy)
- Tissue paper
- Ruler
🔬 Method
- Cut plant tissue cylinders to equal length and diameter.
- Measure and record the initial mass of each cylinder.
- Place each in a separate beaker/test tube with a different sucrose concentration.
- Leave for a fixed time (30–60 minutes).
- Remove, blot gently with tissue paper.
- Measure final mass.
- Calculate % change in mass using:
% change = ((final mass − initial mass) ÷ initial mass) × 100
- Plot % change in mass vs sucrose concentration.
📊 Example Results Table
| Sucrose Conc. (M) | Initial Mass (g) | Final Mass (g) | % Change in Mass |
|---|---|---|---|
| 0.0 | 1.20 | 1.34 | +11.7% |
| 0.2 | 1.25 | 1.30 | +4.0% |
| 0.4 | 1.28 | 1.28 | 0.0% |
| 0.6 | 1.24 | 1.19 | -4.0% |
| 0.8 | 1.27 | 1.18 | -7.1% |
📈 Data Interpretation
- Low sucrose conc. (high Ψ) → tissue gains mass (water enters).
- High sucrose conc. (low Ψ) → tissue loses mass (water leaves).
- The concentration where % change = 0 → tissue Ψ is equal to solution Ψ.
- Use standard Ψ values for sucrose to estimate tissue water potential.
🧠 Conclusion
- Tissue water potential can be estimated from the point of no net mass change.
- Demonstrates osmosis and how water potential differences drive water movement.
📌 Key Points Recap
– Water potential gradient drives osmosis.
– Mass gain/loss depends on whether external Ψ is higher or lower than tissue Ψ.
– Graphical method provides more accurate Ψ estimates.
– Water potential gradient drives osmosis.
– Mass gain/loss depends on whether external Ψ is higher or lower than tissue Ψ.
– Graphical method provides more accurate Ψ estimates.