Analysis of Mass Spectra
At AS / A level, mass spectra are analysed using the m/e values and the relative heights of peaks. Knowledge of how the mass spectrometer works is not required.
Key Features of a Mass Spectrum

- The horizontal axis shows the m/e value
- The vertical axis shows relative abundance
- Each peak corresponds to a particle with a particular m/e value
Molecular Ion Peak
The molecular ion peak has the highest m/e value in the spectrum.
- It represents the molecule as a whole
- Its m/e value gives the relative molecular mass
Isotopic Peaks
Isotopes cause additional peaks at different m/e values. The relative heights of these peaks show isotopic abundance.

- Elements such as chlorine and bromine show distinctive patterns
- Carbon gives a small peak at \( \mathrm{M+1} \) due to \( \mathrm{^{13}C} \)
Chlorine Isotopic Pattern
Chlorine has two common isotopes, \( \mathrm{^{35}Cl} \) and \( \mathrm{^{37}Cl} \).
- Two peaks separated by 2 units in m/e
- Peak height ratio approximately 3 : 1
Bromine Isotopic Pattern
Bromine has two isotopes, \( \mathrm{^{79}Br} \) and \( \mathrm{^{81}Br} \).
- Two peaks separated by 2 units in m/e
- Peaks of approximately equal height
Example
A mass spectrum shows a molecular ion peak at m/e = 78. Deduce the relative molecular mass of the compound.
▶️ Answer / Explanation
The molecular ion peak corresponds to the whole molecule.
The m/e value of 78 gives a relative molecular mass of 78.
Example
A mass spectrum shows two peaks at m/e = 120 and m/e = 122 with a peak height ratio of approximately 3 : 1. Deduce which element is present in the compound and explain your answer.
▶️ Answer / Explanation
The two peaks are separated by 2 units in m/e.
The peak height ratio is approximately 3 : 1.
This matches the isotopic pattern of chlorine.
Calculating Relative Atomic Mass
The relative atomic mass, \( \mathrm{A_r} \), of an element is calculated from the masses of its isotopes and their relative abundances. Data may be given directly or obtained from a mass spectrum.
General Method
- Multiply each isotope mass by its relative abundance
- Add the values together
- Divide by the total abundance
General equation: \( \mathrm{A_r = \dfrac{\sum (isotope\ mass \times abundance)}{\sum abundance}} \)
Using a Mass Spectrum
When a mass spectrum is given:
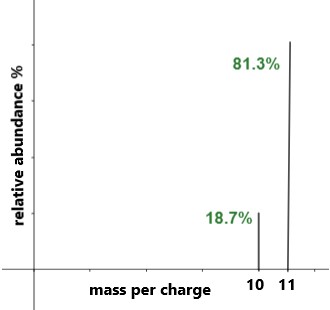
- Each peak corresponds to an isotope
- The m/e value gives the isotopic mass
- The peak height represents relative abundance
Peak heights may be given as percentages or as relative values. Either can be used, provided the same units are used throughout.
Example
An element has two isotopes, X-35 (75%) and X-37 (25%). Calculate the relative atomic mass of X.
▶️ Answer / Explanation
\( \mathrm{A_r = \dfrac{(35 \times 75) + (37 \times 25)}{100}} \)
\( \mathrm{A_r = \dfrac{2625 + 925}{100}} \)
\( \mathrm{A_r = 35.5} \)
Example
A mass spectrum of an element shows two peaks at m/e = 63 and m/e = 65 with relative abundances of 69 and 31. Calculate the relative atomic mass of the element.
▶️ Answer / Explanation
\( \mathrm{A_r = \dfrac{(63 \times 69) + (65 \times 31)}{69 + 31}} \)
\( \mathrm{A_r = \dfrac{4347 + 2015}{100}} \)
\( \mathrm{A_r = 63.62} \)
Deducing Molecular Mass from a Mass Spectrum
The molecular mass of an organic molecule can be deduced from its molecular ion peak in a mass spectrum.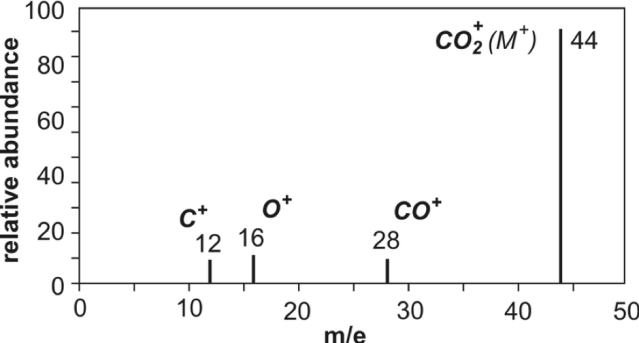
Molecular Ion Peak
The molecular ion peak, often labelled M⁺, corresponds to the molecule as a whole.
- It has the highest m/e value in the spectrum
- It is usually the right-most significant peak
- Its m/e value gives the relative molecular mass
For organic molecules, the molecular ion usually has a charge of +1, so the m/e value is equal to the molecular mass.
Isotopic Considerations
Small peaks at higher m/e values may appear due to isotopes, such as \( \mathrm{^{13}C} \), and should not be confused with the main molecular ion peak.
Example
A mass spectrum of an organic compound shows a molecular ion peak at m/e = 72. Deduce the molecular mass of the compound.
▶️ Answer / Explanation
The molecular ion peak represents the whole molecule.
The m/e value of 72 corresponds to the molecular mass.
The molecular mass of the compound is 72.
Example
A mass spectrum shows two peaks at m/e = 78 and m/e = 79, with the peak at m/e = 78 being the largest. Deduce the molecular mass of the compound and explain your answer.
▶️ Answer / Explanation
The peak at m/e = 78 is the molecular ion peak.
The peak at m/e = 79 is due to the presence of \( \mathrm{^{13}C} \).
The molecular mass of the compound is therefore 78.
Interpreting Fragmentation in Mass Spectra
In addition to the molecular ion peak, mass spectra often show fragmentation peaks. At AS / A level, you must be able to suggest the identity of fragment ions formed by simple bond breaking.
Fragmentation Peaks
Fragmentation occurs when the molecular ion breaks into smaller ions. Each fragment produces a peak at a lower m/e value than the molecular ion.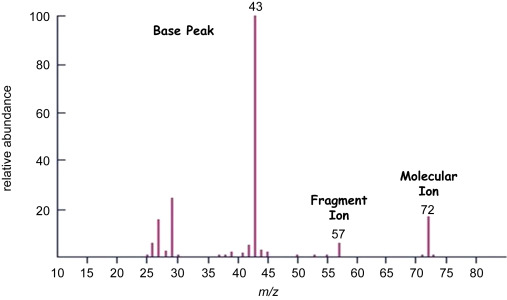
- The fragment ion usually has a charge of +1
- m/e value ≈ relative mass of the fragment
- Only simple fragments are required at AS level
Common Simple Fragment Ions
- m/e = 15 → \( \mathrm{CH_3^+} \)
- m/e = 29 → \( \mathrm{C_2H_5^+} \) or \( \mathrm{CHO^+} \)
- m/e = 31 → \( \mathrm{CH_3O^+} \)
- m/e = 43 → \( \mathrm{C_3H_7^+} \) or \( \mathrm{CH_3CO^+} \)
The identity of the fragment should be consistent with the functional groups present in the original molecule.
Example
A mass spectrum of an organic compound shows a strong peak at m/e = 15. Suggest the identity of the fragment ion responsible for this peak.
▶️ Answer / Explanation
A peak at m/e = 15 corresponds to a fragment with relative mass 15.
This matches the methyl ion, \( \mathrm{CH_3^+} \).
The fragment is formed by breaking a C–C bond.
Example
An organic compound containing an ester group shows a prominent peak at m/e = 43. Suggest the identity of this fragment ion and justify your answer.
▶️ Answer / Explanation
A fragment at m/e = 43 has a relative mass of 43.
This corresponds to the acylium ion, \( \mathrm{CH_3CO^+} \).
This fragment is consistent with the presence of an ester group.
Deducing the Number of Carbon Atoms Using the [M + 1]+ Peak
In mass spectrometry, the number of carbon atoms in an organic compound can be deduced from the relative abundance of the [M + 1]+ peak, which arises mainly due to the presence of the 13C isotope.
Origin of the [M + 1]+ Peak
Carbon exists naturally as a mixture of isotopes. Approximately 1.1% of carbon atoms are 13C.
Each carbon atom therefore increases the chance of forming an ion with an m/e value one unit higher than the molecular ion.
Formula Used
The number of carbon atoms, \( \mathrm{n} \), is calculated using:
\( \mathrm{ n = \dfrac{100 \times \text{abundance of } [M + 1]^+ \text{ ion}} {1.1 \times \text{abundance of } M^+ \text{ ion}} } \)
Abundances may be given as percentages or relative peak heights, but the same units must be used for both peaks.
Example
A mass spectrum shows an \( \mathrm{M^+} \) peak with an abundance of 80 and an \( \mathrm{[M+1]^+} \) peak with an abundance of 4. Calculate the number of carbon atoms in the molecule.
▶️ Answer / Explanation
\( \mathrm{ n = \dfrac{100 \times 4}{1.1 \times 80} } \)
\( \mathrm{ n = \dfrac{400}{88} } \)
\( \mathrm{ n \approx 4.5 } \)
The molecule contains approximately 4 carbon atoms.
Example
An organic compound has an \( \mathrm{M^+} \) peak with a relative abundance of 65 and an \( \mathrm{[M+1]^+} \) peak with a relative abundance of 7.15. Deduce the number of carbon atoms present.
▶️ Answer / Explanation
\( \mathrm{ n = \dfrac{100 \times 7.15}{1.1 \times 65} } \)
\( \mathrm{ n = \dfrac{715}{71.5} } \)
\( \mathrm{ n = 10 } \)
The compound contains 10 carbon atoms.
Deducing the Presence of Chlorine and Bromine Using the [M + 2]+ Peak
Some elements have naturally occurring isotopes that differ in mass by 2 units. In a mass spectrum, this produces a characteristic [M + 2]+ peak, which can be used to deduce the presence of chlorine or bromine in an organic compound.

Chlorine Isotopic Pattern
Chlorine exists as two common isotopes, \( \mathrm{^{35}Cl} \) and \( \mathrm{^{37}Cl} \).
- Produces an \( \mathrm{M^+} \) peak and an \( \mathrm{[M+2]^+} \) peak
- Peaks are separated by 2 m/e units
- Relative peak height ratio is approximately 3 : 1 (M : M+2)
Bromine Isotopic Pattern
Bromine exists as two common isotopes, \( \mathrm{^{79}Br} \) and \( \mathrm{^{81}Br} \).
- Produces an \( \mathrm{M^+} \) peak and an \( \mathrm{[M+2]^+} \) peak
- Peaks are separated by 2 m/e units
- Peaks are of approximately equal height (1 : 1)
These distinctive peak patterns allow chlorine and bromine to be identified unambiguously in a mass spectrum.
Example
A mass spectrum shows two molecular ion peaks at m/e = 106 and m/e = 108 with a peak height ratio of approximately 3 : 1. Deduce which element is present.
▶️ Answer / Explanation
The two peaks are separated by 2 m/e units.
The peak height ratio is approximately 3 : 1.
This isotopic pattern is characteristic of chlorine.
Example
An organic compound shows molecular ion peaks at m/e = 136 and m/e = 138 with almost equal intensities. Deduce the element present and justify your answer.
▶️ Answer / Explanation
The two molecular ion peaks differ by 2 m/e units.
The peaks have approximately equal heights.
This is the characteristic isotopic pattern of bromine.
The compound therefore contains a bromine atom.