AP Biology : 3.2 Enzyme Catalysis – Exam Style questions with Answer- MCQ

Question

Researchers investigated the influence of environmental pH on the activity of peroxidase, an enzyme that catalyzes the conversion of hydrogen peroxide to water and oxygen gas. In an experiment, the researchers added a hydrogen peroxide solution containing guaiacol to several identical test tubes and adjusted the solution in each test tube to a different pH. The researchers included the guaiacol because it caused the solutions to change color as the reactions proceeded, which the researchers relied on for measuring reaction rates. Finally, the researchers added the same amount of peroxidase to each test tube and measured the rate of each reaction at 23°C

. The results of the experiment are represented in Figure 1.

The figure presents a line graph in the coordinate plane. The horizontal axis is labeled p H, and the numbers 0 through 14, in increments of 2, are indicated. The vertical axis is labeled Relative Activity, and no numbers are indicated along it, although the axis ends in an arrowhead. The line begins at the point p H 0 with 0 relative activity, and moves horizontally to the right to p H 1 and 0 relative activity. The line then slants upwards and to the right at a constant rate until p H 2, then slants sharply upwards and to the right at a fairly constant rate until its peak at p H 5. The line then slants sharply downwards and to the right at a constant rate until p H 6, where the relative activity is half that of the peak. The line continues to slant sharply downwards and to the right at a constant rate until p H 7, where the relative activity is one tenth that of the peak. The line then slants less sharply downwards, and to the right at a constant rate until p H 9, where the relative activity is almost 0. The line then slants slightly downwards and to the right at an extremely low constant rate until p H 12 and p H 14, where relative activity drops to 0.
Which of the following actions will provide a negative control for the investigation?
A. Repeating the experiment at 25°C
B. Repeating the experiment using twice the amount of hydrogen peroxide
C. Repeating the experiment using twice the amount of peroxidase
D. Repeating the experiment using heat-denatured peroxidase
▶️Answer/Explanation

Ans: D
A negative control is a group in which no response is expected. It is the opposite of the positive control, in which a known response is expected. Heat-denatured peroxidase will be inactive. Repeating the experiment using heat-denatured peroxidase will allow the researcher to measure reaction rates in the presence of inactive peroxidase.

Question

esearchers investigated the influence of environmental pH on the activity of peroxidase, an enzyme that catalyzes the conversion of hydrogen peroxide to water and oxygen gas. In an experiment, the researchers added a hydrogen peroxide solution containing guaiacol to several identical test tubes and adjusted the solution in each test tube to a different pH. The researchers included the guaiacol because it caused the solutions to change color as the reactions proceeded, which the researchers relied on for measuring reaction rates. Finally, the researchers added the same amount of peroxidase to each test tube and measured the rate of each reaction at 23°C

. The results of the experiment are represented in Figure 1.

The figure presents a line graph in the coordinate plane. The horizontal axis is labeled p H, and the numbers 0 through 14, in increments of 2, are indicated. The vertical axis is labeled Relative Activity, and no numbers are indicated along it, although the axis ends in an arrowhead. The line begins at the point p H 0 with 0 relative activity, and moves horizontally to the right to p H 1 and 0 relative activity. The line then slants upwards and to the right at a constant rate until p H 2, then slants sharply upwards and to the right at a fairly constant rate until its peak at p H 5. The line then slants sharply downwards and to the right at a constant rate until p H 6, where the relative activity is half that of the peak. The line continues to slant sharply downwards and to the right at a constant rate until p H 7, where the relative activity is one tenth that of the peak. The line then slants less sharply downwards, and to the right at a constant rate until p H 9, where the relative activity is almost 0. The line then slants slightly downwards and to the right at an extremely low constant rate until p H 12 and p H 14, where relative activity drops to 0.
One of the researchers proposes using oxygen gas production to measure reaction rates. Which of the following statements best justifies the use of the proposed modification as a way of creating an appropriate control for the investigation?
A. The experiment can be repeated without hydrogen peroxide, which will help eliminate an uncontrolled variable.
B. The experiment can be repeated without peroxidase, which will introduce a second independent variable.
C. The experiment can be repeated without guaiacol, which will reveal the effect of guaiacol on the reaction rates.
D. The experiment can be repeated without water, which will reveal whether the reaction can occur inside a living cell.
▶️Answer/Explanation

Ans: C
In the original experiment, the researchers used guaiacol as a reaction indicator. By using oxygen gas production to measure reaction rates, the researchers no longer need the guaiacol and can repeat the experiment without it, which will reveal the effect of guaiacol on the reaction rates.

Question

Catalase is an enzyme found in yeast cells that facilitates the chemical breakdown of hydrogen peroxide to water and oxygen gas. An experiment was conducted to determine the effect of pH on catalase function. Five buffer solutions of varying pH (2, 4, 6, 8, and 10) were prepared and added to separate test tubes. Hydrogen peroxide (H2O2)

was added to each test tube. Yeast was added, and the reactions were timed. After 1 minute the amount of oxygen gas released was determined by measuring the foam layer produced in each test tube. Figure 1 illustrates the experimental setup.

The figure illustrates the experimental procedure by showing 3 test tubes to indicate the sequence of steps. The first test tube contains a solution of a certain p H. H 2 O 2 is added to this tube. The second test tube contains the solution of a certain p H plus H 2 O 2. A yeast solution is added to this tube. After one minute, the third test tube shows a bracketed area above the surface of the solution, and the area is labeled Measure Foam Layer.
A set of five additional test tubes were prepared and used as controls. Which of the following best describes the contents expected to be contained in one of the five control test tubes?
A. pH 4 buffer solution and hydrogen peroxide only
B. All five pH buffer solutions combined and hydrogen peroxide only
C. Water, hydrogen peroxide, and yeast
D. Water and yeast only
▶️Answer/Explanation

Ans: A
Since the experiment is studying the effect of pH on catalase in yeast, the control set should determine what would happen without yeast present. Each test tube in the control set should contain hydrogen peroxide and one of the pH solutions.

Question

A student designs an experiment to investigate the influence of temperature on enzyme function. The student’s plan is presented in Table 1.

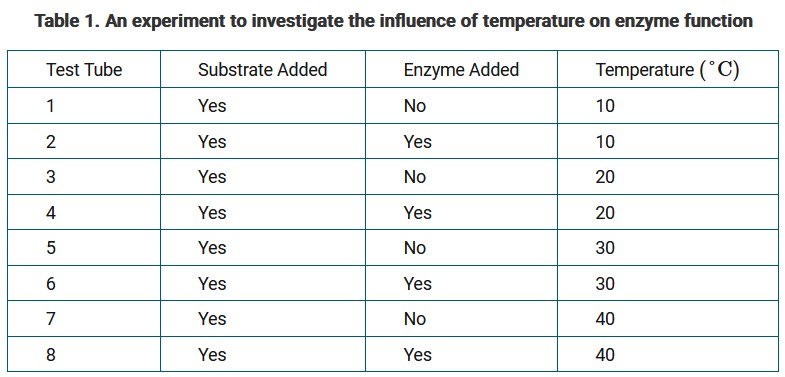
Which test tubes are controls in the experiment?

A. Test tubes 1 and 2 only

B. Test tubes 5 and 6 only

C. Test tubes 1, 3, 5, and 7

D. Test tubes 2, 4, 6, and 8

▶️Answer/Explanation

Ans: C
The test tubes that do not contain the enzyme are negative controls in the experiment. The negative controls help confirm that the results of the experiment are related to enzyme function and not some other factor.

Question

A researcher designs an experiment to investigate whether soil bacteria trigger the synthesis of defense enzymes in plant roots. The design of the experiment is presented in Table 1. For each group in the experiment, the researcher will determine the average rate of change in the amount of defense enzymes in the roots of the seedlings.

Which of the following statements best helps justify the inclusion of group 2 as one of the controls in the experiment?

A. It will show whether the changes observed in group 1 depend on the metabolic activity of soil bacteria.

B. It will show whether the changes observed in group 1 depend on the type of plants used in the experiment.

C. It will show the average growth rate of seedlings that are maintained in a nonsterile environment.

D. It will show the changes that occur in the roots of seedlings following an infection by soil bacteria.

▶️Answer/Explanation

Ans: A
The seedlings in group 1 will be treated with a solution that contains actively reproducing bacteria, which will be metabolically active. In contrast, the seedlings in group 2 will be treated with a solution that contains heat-killed bacteria, which will be metabolically inactive. The researcher will be able to compare the results for group 1 with those for group 2. The comparison will help the researcher determine whether the changes observed in group 1 depend on the metabolic activity of soil bacteria.

Scroll to Top