AP Biology : 3.5 Photosynthesis – Exam Style questions with Answer- MCQ

Question

A researcher claims that spinach leaves capture the most energy from light waves in the range of 500 nm to 600 nm. To test the claim, the researcher will place spinach leaves in separate chambers and expose the leaves to different wavelengths of light. For each chamber, the researcher will measure the amount of oxygen gas (\(O_2\)) that is produced in one hour.

Which of the following graphs best represents data from the experiment that will support the researcher’s claim?

A.

The figure presents the graph of a curve in the coordinate plane. The horizontal axis is labeled Wavelength of Light, in nanometers, and the numbers 400 through 700, in increments of 100, are indicated. The vertical axis is labeled Relative Amount of O 2 Produced in One Hour, and no numbers are indicated along it, although it ends in an arrowhead. The curve begins close to the top of the vertical axis at 400 nanometers, and slants downwards and to the right at a constant rate until it reaches 500 nanometers. The curve then moves horizontally to the right until 600 nanometers. The curve then slants upwards and to the right at a constant rate until it returns to its original height above the horizontal axis at 700 nanometers.

B.

The figure presents the graph of a curve in the coordinate plane. The horizontal axis is labeled Wavelength of Light, in nanometers, and the numbers 400 through 700, in increments of 100, are indicated. The vertical axis is labeled Relative Amount of O 2 Produced in One Hour, and no numbers are indicated along it, although it ends in an arrowhead. The curve begins close to the bottom of the vertical axis at 400 nanometers, and slants upwards and to the right at a constant rate until it reaches 500 nanometers. The curve then moves horizontally to the right until 600 nanometers. The curve then slants downwards and to the right at a constant rate until it returns to its original height above the horizontal axis at 700 nanometers.

C.

The figure presents the graph of a curve in the coordinate plane. The horizontal axis is labeled Wavelength of Light, in nanometers, and the numbers 400 through 700, in increments of 100, are indicated. The vertical axis is labeled Relative Amount of O 2 Produced in One Hour, and no numbers are indicated along it, although it ends in an arrowhead. The curve begins close to the top of the vertical axis at 400 nanometers, and moves downwards and to the right at a decreasing rate until just past 500 nanometers, where it levels out. The curve then moves approximately horizontally to the right until almost 600 nanometers, where it begins to curve downwards and to the right at an increasing rate until 700 nanometers, where it ends slightly above the horizontal axis.

D.

The figure presents the graph of a curve in the coordinate plane. The horizontal axis is labeled Wavelength of Light, in nanometers, and the numbers 400 through 700, in increments of 100, are indicated. The vertical axis is labeled Relative Amount of O 2 Produced in One Hour, and no numbers are indicated along it, although it ends in an arrowhead. The curve begins close to the bottom of the vertical axis at 400 nanometers, and moves upwards and to the right at a decreasing rate until just past 500 nanometers, where it levels out. The curve then moves approximately horizontally to the right until almost 600 nanometers, where it begins to curve upwards and to the right at an increasing rate until 700 nanometers, where it ends close to the top of the vertical axis.

▶️Answer/Explanation

Ans: B
The high levels of \(O_2\) produced at wavelengths between 500 nm and 600 nm directly support the researcher’s claim. Because oxygen is produced as a by-product of photosynthesis, a greater level of oxygen production indicates a greater level of energy-capture from light.

Question

A researcher claims that the initial rise of oxygen in Earth’s early atmosphere, which occurred approximately 2.3 billion years ago, resulted from the metabolic activity of prokaryotic organisms. The claim is based on an interpretation of the geochemical and fossil evidence represented in Figure 1.

The figure presents a timeline represented by a horizontal axis. The horizontal axis is labeled Billions of Years Ago, and the numbers 4.0 through 0, from left to right, in increments of 0.5, are indicated. Six events are indicated along the axis, and are presented as follows. Note that all values are approximate. Evidence of Earliest Organisms, 3.9 billion years ago. Earliest Oxygen, 3.5 billion years ago. Evidence of Cyanobacteria, 2.8 billion years ago. Atmospheric Oxygen, 2.4 billion years ago. Earliest Eukaryotes, 2.0 billion years ago. Earliest Plants, 0.85 billion years ago.

Figure 1. Selected events in geologic time based on geochemical and fossil evidence

Which of the following types of evidence will best support the researcher’s claim?

A. Evidence that some of the earliest eukaryotes used oxygen to produce ATP by cellular respiration

B. Evidence that the earliest plants produced oxygen as a by-product of photosynthesis

C. Evidence that some of the earliest organisms carried out photosynthesis without producing oxygen

D. Evidence that the cyanobacteria produced oxygen as a by-product of photosynthesis

▶️Answer/Explanation

Ans: D
Based on Figure 1, cyanobacteria appear in the fossil record before the rise of oxygen in Earth’s early atmosphere. The researcher’s claim will be supported by evidence that the cyanobacteria that were on Earth more 2.3 billion years ago produced oxygen as a by-product of photosynthesis. Also, cyanobacteria are prokaryotes, which is consistent with the researcher’s claim.

Question

A researcher claims that a certain herbicide suppresses plant growth by inhibiting chloroplast function. To test the claim, the researcher treats isolated chloroplasts with increasing concentrations of the herbicide. The data from the experiment are presented in Table 1.

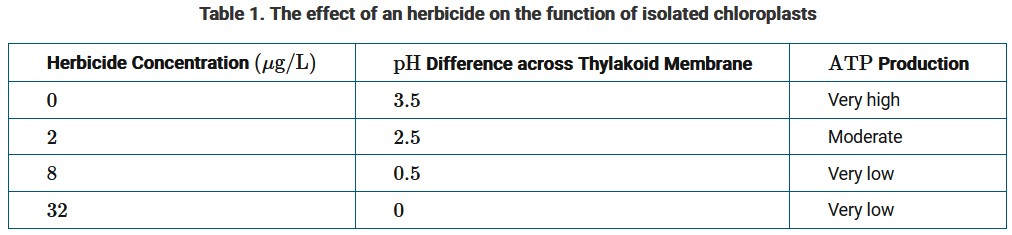
Which of the following statements best clarifies how the data support the researcher’s claim?

A. The thylakoid membrane is more permeable to carbon dioxide than to polar molecules.

B. ATP synthase activity depends on a proton gradient across the thylakoid membrane.

C. Some enzymes embedded in the thylakoid membrane catalyze the hydrolysis of ATP.

D. Carbon fixation in the Calvin-Benson cycle takes place in the stroma of chloroplasts.

▶️Answer/Explanation

Ans: B
The results of the experiment indicate that ATP production in the isolated chloroplasts decreases with increasing concentrations of the herbicide. The data also show that the decrease in ATP production is associated with a decrease in the pH difference across the thylakoid membrane. The pH difference is created by a proton gradient, which ATP synthase relies on to produce ATP.

Question

A researcher claims that increased atmospheric carbon dioxide levels cause increased growth rates in plants.

Which of the following statements best supports the researcher’s claim?

A. Atmospheric carbon dioxide is produced by the burning of fossil fuels, which are formed from the remains of living organisms such as plants.
B. Atmospheric carbon dioxide is a byproduct of cellular respiration, which is a metabolic process that occurs in plants and other living organisms.
C. Atmospheric carbon dioxide typically enters plant leaves through stomata, which plants rely on for regulating gas exchange with the atmosphere.
D. Atmospheric carbon dioxide is the raw material for photosynthesis, which plants rely on for producing sugars and other organic compounds.

▶️Answer/Explanation

Ans: D
Atmospheric carbon dioxide is the raw material for photosynthesis, which is the metabolic process by which green plants use energy in sunlight to produce sugars and other organic compounds. The plants use the sugars and organic compounds to support growth, repair, and reproduction.

Question

In chloroplasts, ATP is synthesized from ADP plus inorganic phosphate (Pi) in a reaction catalyzed by ATP synthase molecules that are embedded in the thylakoid membrane.

Which of the following statements provides evidence to support the claim that no ATP will be synthesized in the absence of a proton gradient across the thylakoid membrane?

A. Blocking electron flow from one carrier to the next in the electron transport chains blocks formation of a proton gradient in the thylakoid.
B. Increasing the proton concentration difference across the thylakoid membrane is not associated with a parallel increase in the rate of ATP synthesis.
C. No ATP is synthesized when channel proteins that allow the free passage of protons are inserted into the thylakoid membrane.
D. No ATP is synthesized while the Calvin cycle is synthesizing carbohydrates and using ATP and NADPH at a high rate.

▶️Answer/Explanation

Ans: C
Channel proteins that allow the passage of protons will dissipate the proton concentration difference, and ATP will not form. Under normal circumstances, the only way for protons to cross the thylakoid membrane is by passing through the ATP synthase molecules.

Scroll to Top