Question
A model of the typical life cycle of a cell is shown in Figure 1.

Figure 1. Typical life cycle of a eukaryotic cell
Scientists have estimated that it takes yeast cells approximately 20 hours to complete the entire cycle. Table 1 shows the amount of time in each phase of the life cycle for yeast cells.
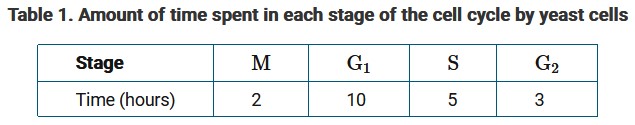
Based on Table 1, what percent of the life cycle of yeast cells is spent in DNA replication?
A. 5 percent
B. 10 percent
C. 25 percent
D. 50 percent
▶️Answer/Explanation
Ans: C
The yeast cells spend 5 hours out of a total of 20 hours in S phase, which is 25%.
Question
Researchers grew seedlings of corn, Zea mays, in loose and compact sand. The researchers measured the amount of time required for the cells in the growing root tips of the seedlings to double in number. The mean cell doubling times for the two groups of seedlings are shown in Figure 1.

Figure 1. Mean cell doubling times for the growing root tips of Zea mays seedlings planted in loose or compact sand
Based on the sample means, which of the following conclusions about the cells in the growing root tips of Zea mays seedlings is best supported by the results of the experiment?
A. The cells of the root tips grow to larger sizes when the seedlings are planted in compact sand than when the seedlings are planted in loose sand.
B. The average rate of mitotic cell division is greater for the root tips growing in loose sand than for the root tips growing in compact sand.
C. The average cell cycle time is greater for the root tips growing in compact sand than for the root tips growing in loose sand.
D. More cells are produced per unit of time in the root tips growing in compact sand than in the root tips growing in loose sand.
▶️Answer/Explanation
Ans: D
According to the figure, the mean cell doubling time of Zea mays seedling root tips in compact sand is less than in loose sand. A lower mean cell doubling time indicates an increased rate of mitotic cell division for cells of root tips in compact sand.
Question
The relative amounts of DNA present in the nucleus of a cell at four different stages of the life cycle are shown in Figure 1.

Figure 1. Relative amounts of DNA
present in the nucleus of a cell
Based on Figure 1, which of the following statements correctly links a stage of the cell cycle with the event occurring at that stage?
A. Stage I represents the \(G_2\) phase of the cell cycle.
B. Synthesis of sufficient DNA for two daughter cells occurs in stage II.
C. Stage III includes mitosis.
D. The replication of genetic material occurs in stage IV.
▶️Answer/Explanation
Ans: B
Stage II represents the S (synthesis) phase of interphase. The genetic information (DNA) is doubling. If this did not occur, the daughter cells formed as a result of the cell cycle would have too little genetic information (chromosomes). This process is visible on the graph, as the copies of genetic information increase from one to two copies.
Question
Researchers tracked the amount of DNA (measured in picograms) over time beginning with a single cell and continuing through several rounds of cell division. The researchers observed threadlike chromosomes prior to cell division. The threadlike chromosomes disappeared from view shortly after each division. The amount of DNA in picograms per cell over several rounds of cell division is shown in Figure 1.

Figure 1. Amount of DNA in picograms per cell over several rounds of cell division
Which of the following statements is consistent with the data in Figure 1?
A. The cells have a haploid chromosome number of 3.
B. The cells have a diploid chromosome number of 6.
C. There is a change from 3 to 6 picograms of DNA because DNA is replicated before each round of cell division.
D. There is a change from 6 to 3 picograms of DNA after each cell division because the chromosomes lengthen following cell division.
▶️Answer/Explanation
Ans: C
The change from 3 to 6 picograms of DNA prior to replication indicates that the DNA has been replicated. The replicated DNA is condensed into chromosomes during cell division or mitosis. This ensures that the complete genome from a parent cell is passed on to two genetically identical daughter cells.