Question
R. C. Punnett conducted experiments on the inheritance of traits in the sweet pea, Lathyrus odoratus. In one experiment, he crossed two different true-breeding sweet pea plant strains, one with erect petals and long pollen, and the other with hooded petals and round pollen. All the offspring (\(F_1\) generation) had erect petals and long pollen (Figure 1).

Figure 1. Sweet pea plant cross
Next, Punnett allowed the \(F_1\) generation to self-fertilize and recorded the phenotypes of their offspring. The data are shown in Table 1.
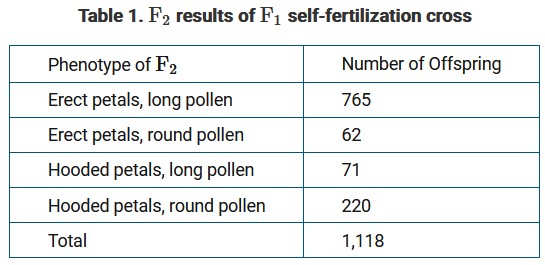
How many degrees of freedom should be used when looking up the critical value for a chi-square analysis of the ratios of phenotypes observed among the \(F_2\) offspring versus the expected phenotypic ratio assuming independent assortment?
A. 2
B. 3
C. 4
D. 5
▶️Answer/Explanation
Ans: B
The number of degrees of freedom is equal to the number of categories minus 1. In this experiment, there are 4 different phenotype combinations, and 4−1=3.
Question
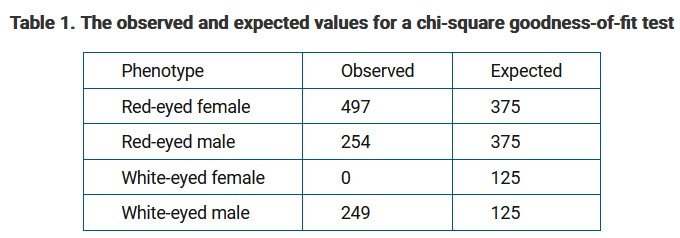
Students carry out a genetics experiment to investigate the inheritance pattern of the white-eye trait in fruit flies. In the experiment, the students cross a red-eyed female with a white-eyed male to produce an \(F_1\) generation. The students observe that all the flies in the \(F_1\) generation have red eyes. The students then allow the F1 flies to mate and produce an \(F_2\) generation. The students will use the \(F_2\) data to perform a chi-square goodness-of-fit test based on a null hypothesis of autosomal recessive inheritance. The observed and expected values for the chi-square goodness-of-fit test are shown in Table 1.
The students plan to use a significance level of p=0.01. Which of the following is the most appropriate critical value for the students to use in their chi-square goodness-of-fit test?
A. 7.82
B. 11.34
C. 13.28
D. 326.7
▶️Answer/Explanation
Ans: B
The critical value for a significance level of p=0.01 and 3 degrees of freedom is 11.34. A calculated chi-square value greater than 11.34 will allow the students to reject the null hypothesis of autosomal recessive inheritance.
Question
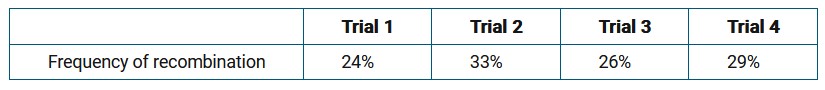
Four trials measuring recombination frequency between gene R and gene L were conducted, and the results are shown in Table 1.
Table 1. Recombination frequency
The mean map distance between gene R and gene L is closest to which of the following?
A. 0.28 map units
B. 28 map units
C. 0.14 map units
D. 14 map units
▶️Answer/Explanation
Ans: B
The recombination frequency is equal to the map distance between genes on the same chromosome. Thus, the mean recombination frequency should be determined, and this is equal to the mean map distance between the two genes.
Question
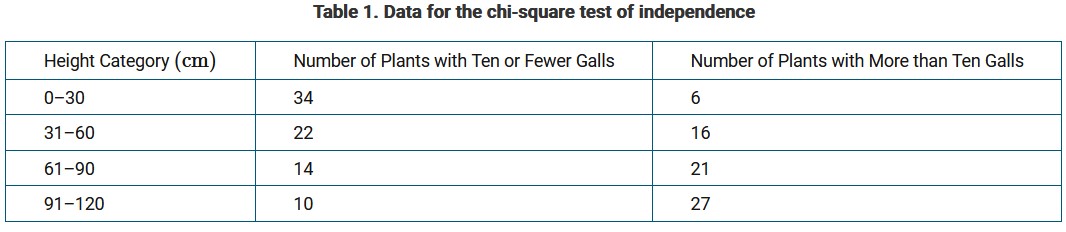
Rubber rabbitbrush plants display heritable variation in plant height and insect-induced gall formation. In a field study, researchers investigated the relationship between plant height and gall number for the rubber rabbitbrush plants in a natural population. The researchers used the data they collected to perform a chi-square test of independence. The null hypothesis for the chi-square test was that plant height and gall number are independent. The data for the chi-square test are presented in Table 1.
The researchers calculated a chi-square value of 29.25. If there are three degrees of freedom and the significance level is p=0.05, which of the following statements best completes the chi-square test?
A. The critical value is 0.05, and the null hypothesis cannot be rejected because the calculated chi-square value is greater than the critical value.
B. The critical value is 0.05, and the null hypothesis can be rejected because the calculated chi-square value is greater than the critical value.
C. The critical value is 7.82, and the null hypothesis cannot be rejected because the calculated chi-square value is greater than the critical value.
D. The critical value is 7.82, and the null hypothesis can be rejected because the calculated chi-square value is greater than the critical value.
▶️Answer/Explanation
Ans: D
The critical value is 7.82. Because the calculated chi-square value is greater than the critical value, the null hypothesis can be rejected.