AP Biology : 5.6 Chromosomal Inheritance – Exam Style questions with Answer- MCQ

Question

A model showing the cells in anaphase I and anaphase II of meiosis during a nondisjunction event is shown in Figure 1

The figure presents Anaphase 1 and Anaphase 2. Anaphase 1 consists of one circle representing a cell in which there are four chromosomes, each shown as a pair of chromatids. Two of the chromosomes are large and similar in shape, and two of the chromosomes are small and similar in shape. In Anaphase 2 the one circle has split into two circles, representing two cells. One of the circles contains four individual chromosomes, two large and two small. The other circle contains two individual small chromosomes and one large chromosome that is still composed of a pair of chromatids and is labeled nondisjunction.

Figure 1. Model of a nondisjunction event

Which of the following best predicts the effect of the chromosomal segregation error shown in Figure 1?

A. All of the resulting gametes will have an extra chromosome.

B. All of the resulting gametes will be missing a chromosome.

C. Half of the resulting gametes will have an extra chromosome and the other half will be missing a chromosome.

D. Half of the resulting gametes will have the correct number of chromosomes, and the other half will have an incorrect number of chromosomes.

▶️Answer/Explanation

Ans: D
In this instance, nondisjunction of sister chromatids during meiosis II will produce two gametes with the correct number of chromosomes (n). The remaining two gametes that are produced will be n+1 and n1, respectively.

Question

Sex chromosomes determine the phenotype of sex in humans. Embryos containing XX chromosomes develop into females, and embryos containing XY chromosomes develop into males. The sex chromosomes separate during meiosis, going to different gamete cells.
A woman is heterozygous for the X-linked recessive trait of hemophilia A. Her sex chromosomes can be designated as \(X^HX^h\). During meiosis the chromosomes separate as shown in Figure 1.

The figure presents a transmission pattern for the X-linked trait hemophilia. A key indicates that X with a superscript uppercase H represents Normal clotting, dominant, and X with a superscript lowercase h represents Hemophilia, recessive. The genotype X with a superscript uppercase H, X with a superscript lowercase h is followed by two arrows representing chromosome separation during meiosis. At the end of one arrow is X with a superscript uppercase H, and at the end of the other arrow is X with a superscript lowercase h.

Figure 1. Transmission pattern for sex chromosomes of a woman heterozygous for hemophilia A

into gametes

If the woman and a man with normal clotting function have children, what is the probability of their children exhibiting hemophilia A

A. 50 percent for daughters, 0 percent for sons
B. 50 percent for sons, 0 percent for daughters
C. 50 percent for all children
D. 0 percent for all children
▶️Answer/Explanation

Ans: B
Half of the sons would inherit the \(X^H\) allele from the woman and a Y chromosome from the man. Without a \(X^H\) allele, these sons would develop hemophilia A.

Question

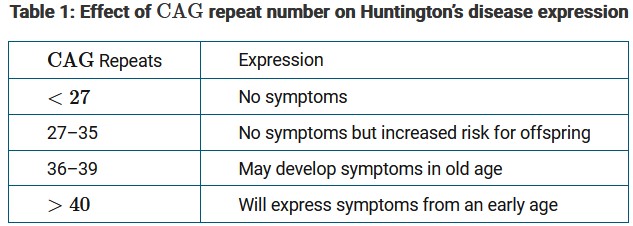
Huntington’s disease has been traced to the number of CAG repeats in the HTT gene, which is located on chromosome 4. The phenotypic influence of individual alleles with different numbers of repeats is shown in Table 1.

Which of the following is most likely the immediate cause of the first appearance of Huntington’s disease in a person?

A. A point mutation occurs in the HTT gene.

B. The first appearance of the CAG repeat occurs in the HTT gene.

C. An allele with more than 39 CAG repeats was inherited by the affected person.

D. The person inherited two alleles that each contained 20 CAG repeats.

▶️Answer/Explanation

Ans: C
At some point, all alleles for the HTT gene contain less than 39 CAG repeats. Only after this threshold is crossed will a person inherit an allele that will cause symptoms of Huntington’s disease.

Question

Figure 1 illustrates the X and Y chromosomes during meiosis I and meiosis II of normal spermatogenesis in a mammal species.

The figure presents a graphic of the X and Y chromosomes during normal spermatogenesis in a mammal species. To start, a single cell is represented with an X chromosome composed of two chromatids and a smaller Y chromosome composed of two chromatids. Meiosis 1 results in two cells, one of which contains the X chromosome composed of two chromatids and one of which contains the Y chromosome composed of two chromatids. Meiosis 2 results in 4 gametes, two of which contain a single X chromosome and two of which contain a single Y chromosome.

Figure 1. X and Y chromosomes during meiosis I and meiosis II


If the normal spermatogenesis is disrupted, the gametes can have different chromosomes than expected. Which of the following is the most likely cause of one of the four gametes having two X chromosomes and one having neither an X nor a Y chromosome?

A. Nondisjunction of the chromosomes during meiosis I
B. Nondisjunction of both the X and Y chromosomes during meiosis II
C. Nondisjunction of the Y chromosome during meiosis II
D. Nondisjunction of the X chromosome during meiosis II

▶️Answer/Explanation

Ans: D
A nondisjunction event of the X chromosome in meiosis II would result in both of the X chromatids going to one gamete and no X chromatids going to the other gamete.

Question

Trisomy 21 is a condition in which a child is born with an extra chromosome in pair 21. Researchers assessed the frequency of children born with trisomy 21 by age of the mothers at birth (maternal age) and primary cause of the error leading to trisomy 21. The findings are presented in Figure 1.

The figure presents a stacked bar graph. The horizontal axis is labeled Maternal Age-Group, and the following three age-groups are indicated: less than 29, 29 through 34, and greater than 34. The vertical axis is labeled Rate of Trisomy 21 per 1,000 births, and no values are indicated, although an arrowhead is present at the top end of the axis. A key indicates that the data represent: error in mitosis; error in meiosis during spermatogenesis; error in meiosis 1 during oogenesis; and error in meiosis 2 during oogenesis. The bar representing Rate of Trisomy 21 is smallest in the age group Less than 29. In comparison to the Less than 29 age group bar, the bar for the age group 29 through 34 is twice the height, and the bar for the age group of Greater than 34 is five times the height. The absolute sizes of the fraction of each bar representing error in mitosis and error in meiosis during spermatogenesis remain small and approximately constant across all three age groups. Error in meiosis 1 during oogenesis comprises approximately one sixth of the Less than 29 bar, one sixth of the 29 through 34 bar, and one fourth of the Greater than 34 bar. Error in Meiosis 2 during oogenesis comprises approximately two thirds of each of the three bars.

Figure 1. Incidence and primary cause of trisomy 21 by maternal age-group

Based on the data in Figure 1, which of the following is most likely the primary cause of the pattern of frequency of trisomy 21 births in the selected maternal age-groups?

A. At older maternal ages, there is an increase in the number of errors during mitosis, which leads to an increase in nondisjunction during egg production.
B. The incidence of nondisjunction errors in meiosis during sperm production is positively correlated with increasing maternal age.
C. At older maternal ages, the incidence of errors in meiosis during egg production increases, which leads to an increase in nondisjunction
D. Errors in meiosis leading to nondisjunction are more likely to occur during meiosis I than during meiosis II.

▶️Answer/Explanation

Ans: C
Maternal age is correlated with a significant increase in meiotic errors during egg maturation. Figure 1 shows that most of trisomy 21 births are due to these errors, with the number of these errors observed increasing significantly with maternal age.

Scroll to Top