AP Biology : 6.4 Translation – Exam Style questions with Answer- MCQ

Question

Molecular biologists are studying the processes of transcription and translation and have found that they are very similar in prokaryotes and eukaryotes, as summarized in Table 1.

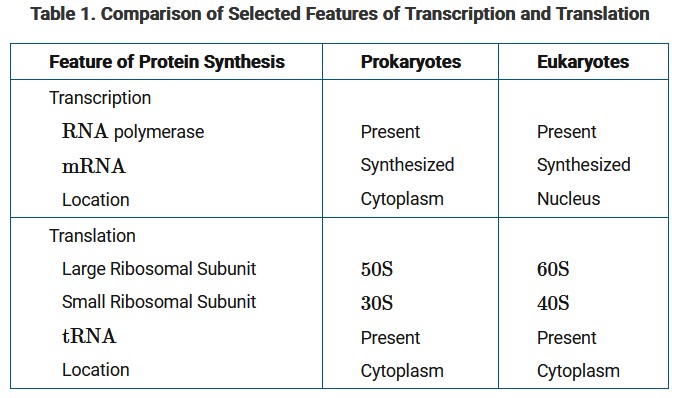
Based on the information in Table 1, which of the following best predicts a key difference in prokaryotes and eukaryotes with regard to transcription and translation?

A. The two processes will occur simultaneously in prokaryotes but not eukaryotes.
B. Prokaryotic mRNA is shorter than eukaryotic mRNA.
C. Eukaryotic mRNA contains more coding regions than prokaryotic DNA.
D. The processing of mRNA by eukaryotes is required for the mRNA to leave the nucleus.

▶️Answer/Explanation

Ans: A
Since transcription and translation both occur in the cytoplasm, they can occur simultaneously in prokaryotes. Note that the spatial separation of these two processes in eukaryotes increases the capacity for gene regulation.

Question

Antibiotics interfere with prokaryotic cell functions. Streptomycin is an antibiotic that affects the small ribosomal subunit in prokaryotes. Specifically, streptomycin interferes with the proper binding of tRNA to mRNA in prokaryotic ribosomes.

Which of the following best predicts the most direct effect of exposing prokaryotic cells to streptomycin?

A. Amino acid synthesis will be inhibited.
B. No mRNA will be transcribed from DNA.
C. Posttranslational modifications will be prevented.
D. Synthesis of polypeptides will be inhibited.

▶️Answer/Explanation

Ans: D
Translation of mRNA involves assembling polypeptides from amino acids attached to tRNA specific for each amino acid. Streptomycin prevents the ribosome from interacting properly with tRNA, preventing the synthesis of needed proteins and leading to the death of the prokaryote.

Question

Nuclear pores regulate the passage of substances into and out of the nucleus. Antibodies such as mAb414 have been used to inhibit the movement of substances through the nuclear pores of rat liver cells. Scientists cultured rat liver cells (eukaryotic) and bacteria cells (prokaryotic) in separate dishes with radioactively labeled amino acids. A specific gene in both cell types was engineered to synthesize identical polypeptide chains, and translation of this gene was measured. The procedure was repeated with mAb414 (the inhibitor) added to each of the two cell cultures, and translation was monitored again.

Which of the following sets of graphs best summarizes the results of the experiments?

The figure presents a key that indicates a solid line represents eukaryotic cells and a dashed line represents prokaryotic cells.

A.

The figure presents two graphs of lines in coordinate planes. In each graph, the horizontal axis is labeled Hours of Culture and the numbers 0 and 5 are indicated at the beginning and end of the axis, respectively. The vertical axis is labeled Relative Length of Polypeptide Chain. Note, all data are approximate. The first graph is titled Control, No Inhibitor. The solid line begins slightly above the origin and to the right of the vertical axis. It moves up and to the right, ending at 4 hours and near the top of the vertical axis. The dashed line is slightly to the right of the solid line and is parallel to it. The second graph is titled Experimental, with Inhibitor. The solid line begins slightly to the right of the vertical axis and slightly above the horizontal axis. It extends parallel to the horizontal axis and ends just after 5 hours. The dashed line is identical to the dashed line in the Control, No Inhibitor graph. It begins just to the right of the vertical axis and just above the origin of the solid line and moves up and to the right ending at 4 hours and near the top of the vertical axis.

B.

The figure presents two graphs of lines in coordinate planes. In each graph, the horizontal axis is labeled Hours of Culture and the numbers 0 and 5 are indicated at the beginning and end of the axis, respectively. The vertical axis is labeled Relative Length of Polypeptide Chain. Note, all data are approximate. The first graph is titled Control, No Inhibitor. The solid line begins slightly above the origin and to the right of the vertical axis. It moves up and to the right, ending at 4 hours and near the top of the vertical axis. The dashed line is slightly to the right of the solid line and is parallel to it. The second graph is titled Experimental, with Inhibitor. The solid line is identical to the solid line in the Control, No Inhibitor graph. The solid line begins slightly above the origin and to the right of the vertical axis. It moves up and to the right, ending at 4 hours and near the top of the vertical axis. The dashed line begins slightly to the right of the vertical axis and slightly above the horizontal axis. It extends parallel to the horizontal axis and ends just after 5 hours.
C.The figure presents two graphs of lines in coordinate planes. In each graph, the horizontal axis is labeled Hours of Culture and the numbers 0 and 5 are indicated at the beginning and end of the axis, respectively. The vertical axis is labeled Relative Length of Polypeptide Chain. Note, all data are approximate. The first graph is titled Control, No Inhibitor. The solid line begins slightly above the origin and to the right of the vertical axis. It moves up and to the right, ending at 4 hours and near the top of the vertical axis. The dashed line is slightly to the right of the solid line and is parallel to it. The second graph is titled Experimental, with Inhibitor. The solid line begins slightly above the origin and to the right of the vertical axis. It moves slightly up and to the right. At 3 hours and half way up the vertical axis, the line moves horizontally to the right and ends just after 5 hours. The dashed line is identical to the dashed line in the Control, No Inhibitor graph. It begins just to the right of the vertical axis and just above the origin of the solid line and moves up and to the right ending at 4 hours and near the top of the vertical axis.
D.

The figure presents two graphs of lines in coordinate planes. In each graph, the horizontal axis is labeled Hours of Culture and the numbers 0 and 5 are indicated at the beginning and end of the axis, respectively. The vertical axis is labeled Relative Length of Polypeptide Chain. Note, all data are approximate. The first graph is titled Control, No Inhibitor. The solid line begins slightly above the origin and to the right of the vertical axis. It moves up and to the right ending at 4 hours and near the top of the vertical axis. The dashed line is slightly to the right of the solid line and is parallel to it. The second graph is titled Experimental, with Inhibitor. The solid line is identical to the solid line in the Control, No Inhibitor graph. The solid line begins slightly above the origin and to the right of the vertical axis. It moves up and to the right, ending at 4 hours and near the top of the vertical axis. The dashed line begins slightly above the origin and to the right of the vertical axis. It moves slightly up and to the right. At 3 hours and half way up the vertical axis, the line moves horizontally to the right and ends just after 5 hours.

▶️Answer/Explanation

Ans: A
In eukaryotes, transcription and translation occur at different areas in the cell, whereas in prokaryotes, they occur simultaneously. In the experimental dish with the eukaryotes, the drug inhibited the translocation of mRNA to the cytoplasm, thereby preventing the translation, so no polypeptide chain was formed. However, in the prokaryotes, with no nucleus and both processes occurring simultaneously, translation occurred and the polypeptide chain was formed.

Question

What would be the minimum number of nucleotides required to code for a protein made of 12 amino acids?
(A) 6
(B) 12
(C) 36
(D) 48

▶️Answer/Explanation

Ans:

(C) Each amino acid is coded by a three base pair codon, so a protein
made of 12 amino acids would require a minimum of 12 × 3 = 36
nucleotides. Choice (A) is incorrect because 6 nucleotides would only
contain two codons. Since 3 nucleotides are required to make a codon,
12 nucleotides would only be sufficient to code for four amino acids, so
choice (B) is incorrect. While 48 nucleotides might code for 12 amino
acids if there were introns to be removed, 48 is not the minimum
number of nucleotides required, so choice (D) is incorrect.

Question

A scientist inserts a eukaryotic gene directly into a bacteria’s genome. However, the protein produced by the bacteria from the eukaryotic gene does not have the same amino acid sequence as the protein produced from the gene in eukaryotic cells. Which of the following best explains this?
(A) Prokaryotes and eukaryotes do not use the same genetic code, so
the bacteria cannot decode the eukaryotic gene.
(B) Eukaryotic genes contain introns, which must be removed before
translation; prokaryotes cannot remove introns.
(C) Prokaryotes do not have a nucleus and cannot perform
transcription.
(D) Prokaryotes do not have rough endoplasmic reticulum, so they
cannot translate eukaryotic genes.

▶️Answer/Explanation

Ans:

(B) Eukaryotic genes contain introns; prokaryotic genes do not.
Prokaryotes do not have the spliceosomes required to remove introns.
So if a eukaryotic gene was directly inserted into a bacterial genome,
the bacteria would likely try to translate the introns and produce a
different protein. Choice (A) is incorrect because prokaryotes and
eukaryotes do use the same genetic code. While prokaryotes do not
have a nucleus, they do contain RNA polymerase and can perform
transcription, so choice (C) is incorrect. Choice (D) is incorrect because
rough endoplasmic reticulum is not required for the translation of all
proteins.

Scroll to Top