Question
Topic – 6.6 Gene Expression and Cell Specialization
(a) – Topic – 6.6 Gene Expression and Cell Specialization
(b) – Topic – 6.6 Gene Expression and Cell Specialization
(c) – Topic – 6.6 Gene Expression and Cell Specialization
(d) – Topic – 6.6 Gene Expression and Cell Specialization
Housekeeping genes encode proteins involved in universally important processes such as transcription, translation, and glycolysis. Because these genes appear to be expressed in all cells at constant levels, the
expression of housekeeping genes is often used as a control when comparing how the expression of other genes varies under different conditions.
Researchers studying the effect of pesticides on declining bee populations wanted to determine whether the expression of four housekeeping genes (GAPDH, RPL32, RPS5, and TBP-AF) was in fact constant in bees across different variables. The researchers collected samples of mRNA for each of the four genes and compared how their expression varied across the developmental stage of the bee, the sex of the bee, and the cell type from which the sample was taken. The mRNA from the samples was reverse transcribed to produce DNA copies of each gene. PCR was then used to amplify the DNA, and the \(C_{q}\) value was determined. The \(C_{q}\) value is the number of PCR cycles needed to produce a specified number of DNA copies. A high \(C_{q}\) value for a sample indicates the gene was expressed at a low level.
To analyze whether any of the examined variables affected expression of the housekeeping genes, researchers examined the range of \(C_{q}\) values for each gene in response to each variable. Genes with a wide range of \(C_{q}\) values were determined to be affected by the variable, while genes with a narrow range of \(C_{q}\) values were determined to be unaffected by the variable.
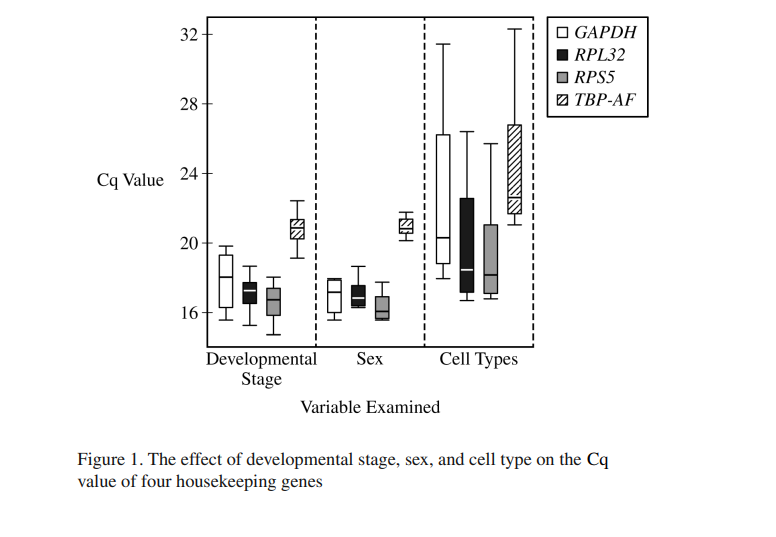
(a) Based on the data in Figure 1, identify the gene that had the lowest median \(C_{q}\) value when bees of different developmental stages were compared.
(b) The \(C_{q}\) value is inversely proportional to the amount of mRNA from that gene in the starting sample. Based on the data in Figure 1, identify the gene that has the lowest level of gene expression regardless of variable.
(c) The scientists investigated the effect of pesticides on the expression of other genes in one cell type of a group of bees containing males and females of the same developmental stage. They hypothesized that
TBP-AF would serve as the best control gene for this experiment. Use the data to evaluate their hypothesis.
(d) Explain how expression of a gene such as GAPDH can vary from one cell type to another within the same bee.
▶️Answer/Explanation
6(a) Based on the data in Figure 1, identify the gene that had the lowest median \(C_{q}\) value when bees of different developmental stages were compared.
• RPS5
6(b) The \(C_{q}\) value is inversely proportional to the amount of mRNA from that gene in the starting sample. Based on the data in Figure 1, identify the gene that has the lowest level of gene expression regardless of variable.
• TBP-AF
6(c) The scientists investigated the effect of pesticides on the expression of other genes in one cell type of a group of bees containing males and females of the same developmental stage. They hypothesized that TBP-AF would serve as the best control gene for this experiment. Use the data to evaluate their hypothesis.
• Their hypothesis is supported because TBP-AF has the smallest \(C_{q}\) range/most constant expression (when comparing sexes).
6(d) Explain how expression of a gene such as GAPDH can vary from one cell type to another within the same bee.
• Different cell types contain different levels of/different transcription factors, and therefore regulate the expression of genes in different ways.