Question
TOPIC 7.4 Population Genetics
(a) – TOPIC 7.10 Speciation
(b) – TOPIC 7.11 Variations in Populations
(c) – TOPIC 8.1 Responses to the Environment
(d) – TOPIC 8.1 Responses to the Environment
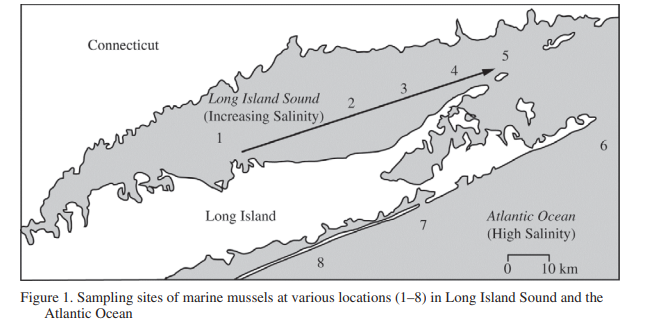
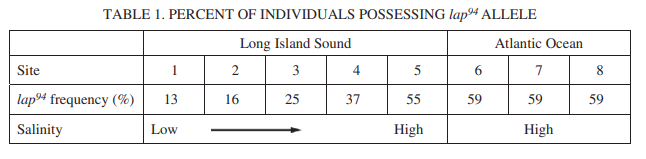
Leucine aminopeptidases (LAPs) are found in all living organisms and have been associated with the response of the marine mussel, Mytilus edulis, to changes in salinity. LAPs are enzymes that remove N-terminal amino acids from proteins and release the free amino acids into the cytosol. To investigate the evolution of LAPs in wild populations of M. edulis, researchers sampled adult mussels from several different locations along a part of the northeast coast of the United States, as shown in Figure 1. The researchers then determined the percent of individuals possessing a particular lap allele, lap94, in mussels from each sample site (table 1).
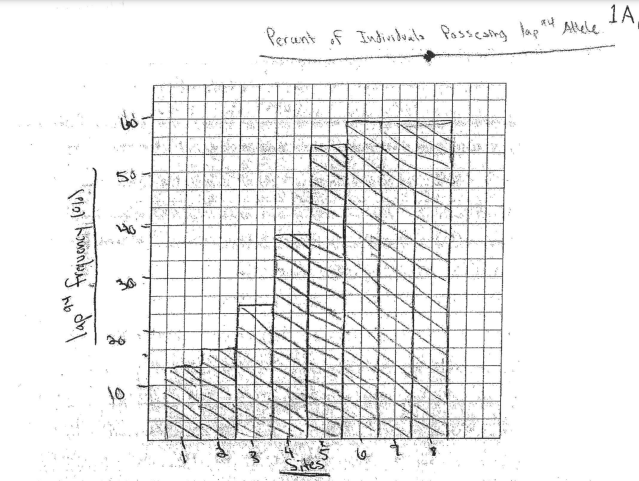
(a) On the axes provided, construct an appropriately labeled bar graph to illustrate the observed frequencies of the lap94 allele in the study populations.
(b) Based on the data, describe the most likely effect of salinity on the frequency of the lap94 allele in the marine mussel populations in Long Island Sound. Predict the likely lap94 allele frequency at a sampling site between site 1 and site 2 in Long Island Sound.
(c) Describe the most likely effect of LAP94 activity on the osmolarity of the cytosol. Describe the function of LAP94 in maintaining water balance in the mussels living in the Atlantic Ocean.
(d) Marine mussel larvae are evenly dispersed throughout the study area by water movement. As larvae mature, they attach to the rocks in the water. Explain the differences in lap94 allele frequency among adult mussel populations at the sample sites despite the dispersal of larvae throughout the entire study area. Predict the likely effect on distribution of mussels in Long Island Sound if the lap94 allele was found in all of the mussels in the population. Justify your prediction.

Answer/Explanation
Ans:
(a) On the axes provided, construct an appropriately labeled bar graph to illustrate the observed frequencies of the lap94 allele in the study populations. (3 points)
Construct graph (3 points)
• Correctly plotted bar graph that accurately represents the trend
• Correct axis labeling
• Correct scale and units
(b) Based on the data, describe the most likely effect of salinity on the frequency of the lap94 allele in the marine mussel populations in Long Island Sound. Predict the likely lap94 allele frequency at a sampling
site between site 1 and site 2 in Long Island Sound. (2 points)

(c) Describe the most likely effect of LAP94 activity on the osmolarity of the cytosol. Describe the function of LAP94 in maintaining water balance in the mussels living in the Atlantic Ocean. (2 points)

(d) Marine mussel larvae are evenly dispersed throughout the study area by water movement. As larvae mature, they attach to the rocks in the water. Explain the differences in lap94 allele frequency among adult mussel populations at the sample sites despite the dispersal of larvae throughout the entire study area. Predict the likely effect on distribution of mussels in Long Island Sound if the lap94 allele was found in all of the mussels in the population. Justify your prediction. (3 points)

(b) The most likely effect on the frequency of the lap94 allele is that an increase in salinity is associated with an increase in the frequency of the lap94 allele. There is a direct relationship. The lap94 allele frequency between site 1 and site 2 is 15%.
(c) Lap94 activity releases amino acids in the cytosol which lower the water polenta (ψ) inside of the cell. This leads to a flow of water into the cell. The reason why lap94 activity increase as salinity increases is because the hypertense environment surrounding the cell would cause the water inside the cell to leave, eventually the cell would plasmolyze and die. Lap94 attempts to counterbalance the effect of an increase in salinity. Attempting to create an isotones solution.
(d) The differences in lap94 allele frequency are due to the differences of salinity at the sites where adult mussels attach themselves to rocks. A higher population of individuals with the lap94 allele will survive in areas of high salinity. That is why the frequency of the allele is different across the data presented. There would be a greater number of mussels in area of high salinity if all the mussels with the allele were in area of low salinity then water would flow into the cell causing it to burst.