Question
A population of 45 geese are introduced to a lake. The birth rate of the population is 0.28 geese per year, and the death rate is 0.18 geese per
year.
(a) Calculate the rate of population growth.
(b) Determine whether the population of geese is increasing or decreasing.
(c) The carrying capacity for geese at this lake is about 80 geese.
Make a prediction about the population of geese relative to the lake’s carrying capacity for geese in the next 10 years.
(d) Justify your prediction from part (c).
▶️Answer/Explanation
Ans:
(a) The rate of population growth is \(\frac{dN}{dt}\) = birth rate – death rate = 0.28 – 0.18 = 0.10 gesse per year.
(b) This population of geese is increasing because the birth rate is
greater than the death rate.
(c) It is expected that the geese population will exceed the carrying
capacity of the lake within the 10-year period.
(d) The growth rate of the geese population is 0.10, or 10%. If that
growth rate continues over the next 10 years, the population of
geese will exceed the lake’s carrying capacity before the end of the
10-year period.
Question
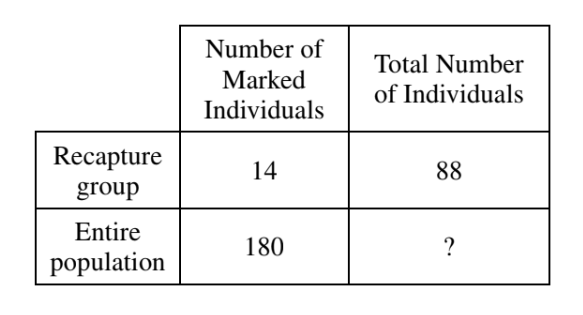
To estimate the size of an animal population, researchers often use a method known as mark- recapture, which involves marking individuals from a large population for easy identification
upon recapture. The mark-recapture method assumes that the proportion of marked individuals in the recapture group is equal to the proportion of marked individuals in the entire population. Researchers used the mark-recapture method to estimate the number of individuals in a population.
Using the results presented in the table below, estimate the total number of individuals in the population. Give your answer to the nearest whole number.

▶️Answer/Explanation
1131
Question.

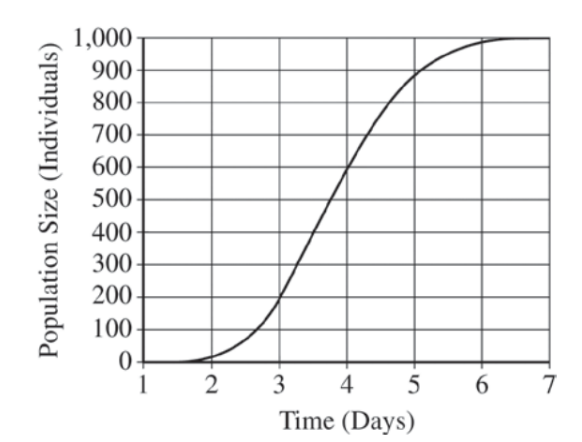
Use the graph above to calculate the mean rate of population growth (individuals per day) between day 3 and day 5. Give your answer to the nearest whole number.
▶️Answer/Explanation
Ans: 340–360
The correct answer is 340–360. The graph depicts a logistic growth curve for a population. The formula to calculate the per capita rate increase between days 3 and 5 is ∆N/∆T, where ∆N=change in population size and ∆T=time interval. In other words, ∆N/∆T = 900 individuals-200 individuals/2 days=700 individuals/2 days. However, the mean rate of population growth is for 1 day, or 350 individuals/day.
