Question
A population of 45 geese are introduced to a lake. The birth rate of the population is 0.28 geese per year, and the death rate is 0.18 geese per
year.
(a) Calculate the rate of population growth.
(b) Determine whether the population of geese is increasing or decreasing.
(c) The carrying capacity for geese at this lake is about 80 geese. Make a prediction about the population of geese relative to the lake’s carrying capacity for geese in the next 10 years.
(d) Justify your prediction from part (c).
▶️Answer/Explanation
Ans:
(a) The rate of population growth is \(\frac{dN}{dt}\) = birth rate – death rate = 0.28 – 0.18 = 0.10 gesse per year.
(b) This population of geese is increasing because the birth rate is
greater than the death rate.
(c) It is expected that the geese population will exceed the carrying
capacity of the lake within the 10-year period.
(d) The growth rate of the geese population is 0.10, or 10%. If that
growth rate continues over the next 10 years, the population of
geese will exceed the lake’s carrying capacity before the end of the
10-year period.
Question.
Environmental factors have a profound effect on the size and growth rate of populations of living organisms.
(a) Describe r- and K-life-history strategies.
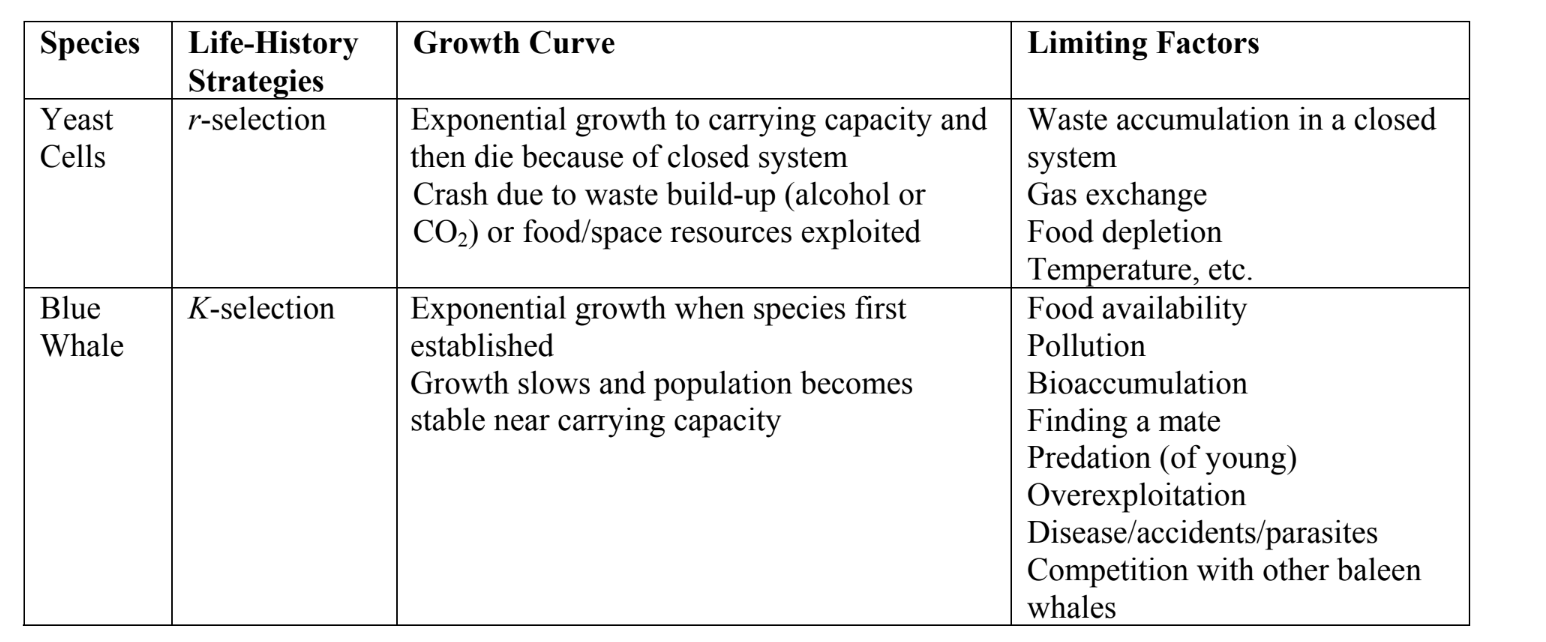
(b) For EACH of the following, identify the life-history strategy, and describe the population growth curve and limiting factor.
• Yeast cells growing in a closed flask with an initial volume of nutrient broth
• A blue whale (the largest baleen whale) living in the ocean
(c) Describe the growth of the global human population for the last 10,000 years (you may want to include a labeled graph as part of your discussion).
(d) Discuss TWO factors that affect human population growth.
▶️Answer/Explanation
(a)
• r-selection—exponential growth, quick reproduction and maturity
• K-selection—produce few offspring, parental care high, long gestation
(b)

(c)
• Relatively flat population from 10,000 years ago until the agricultural revolution
• Slight increase in population as a result of the agricultural revolution (circa 6000–7000 BCE)
• Indication of an approximate 25 percent decrease in population due to the plague during the Middle Agesm (circa 1400 CE)
• Increase in population growth rate due to the industrial revolution (circa eighteenth century).
• Technological and agricultural mechanization (“green revolution”) and increased medical treatments (twentieth century)
• Exponential growth continues, perhaps beyond a stable carrying capacity
(c) • Resource availability
− Arable land
− Water
− Food
• Intraspecific competition = wars
• Density dependent spread of disease, parasites, etc. = pandemics, plagues
• Depletion of nonrenewable resources
Question.

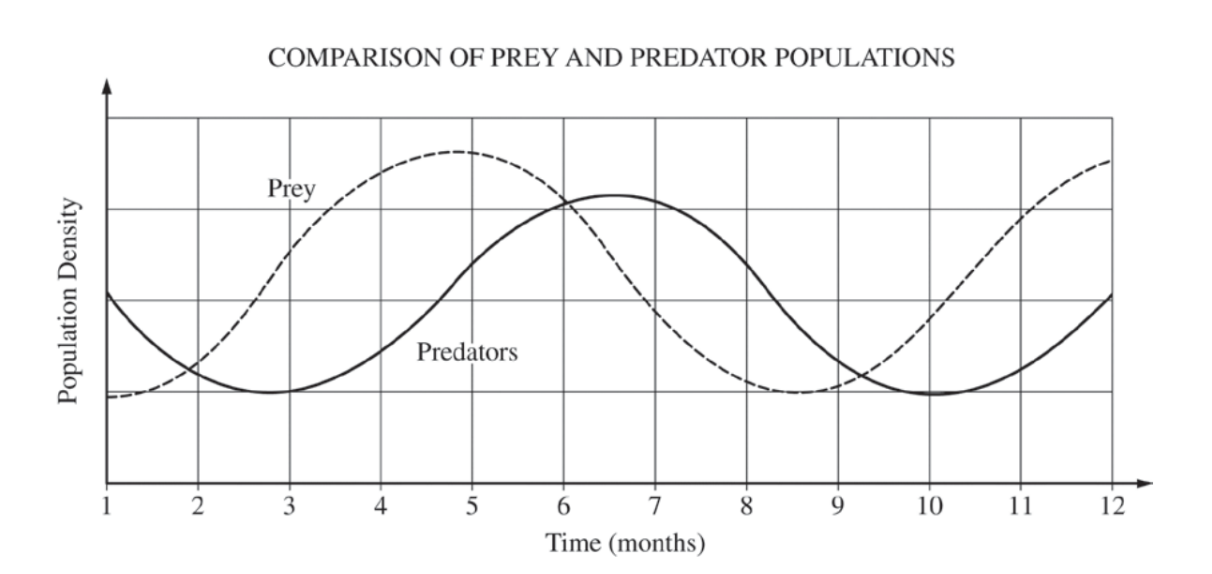
Use the graph above to calculate the lag time in months between the change in the densities of the prey and the predator populations. Give your answer to the nearest tenth of a month.
▶️Answer/Explanation
Ans:1.4–1.7 The correct answer could be any value from 1.4–1.7 months. Note: The data are reflective of actual data. To calculate the lag time in months between the change in the densities of the prey and the predator populations, calculate the differences between the prey and predator peaks or valleys. The first peak of oscillation is the prey at 4.8 months; the predator hits the first peak at approximately 6.5 months. The first valley of oscillation is the prey at 8.5 with the second at 10. When calculating the difference between lag time, subtract 8.5 from 10 to obtain 1.5 months.
