7.9.A – Evidence to Infer Evolutionary Relationships
🧬 What It Means:
Scientists don’t need a time machine to figure out how species are related – instead, they use different types of evidence to reconstruct the evolutionary tree of life. 🌳
🔍 Main Types of Evidence Used: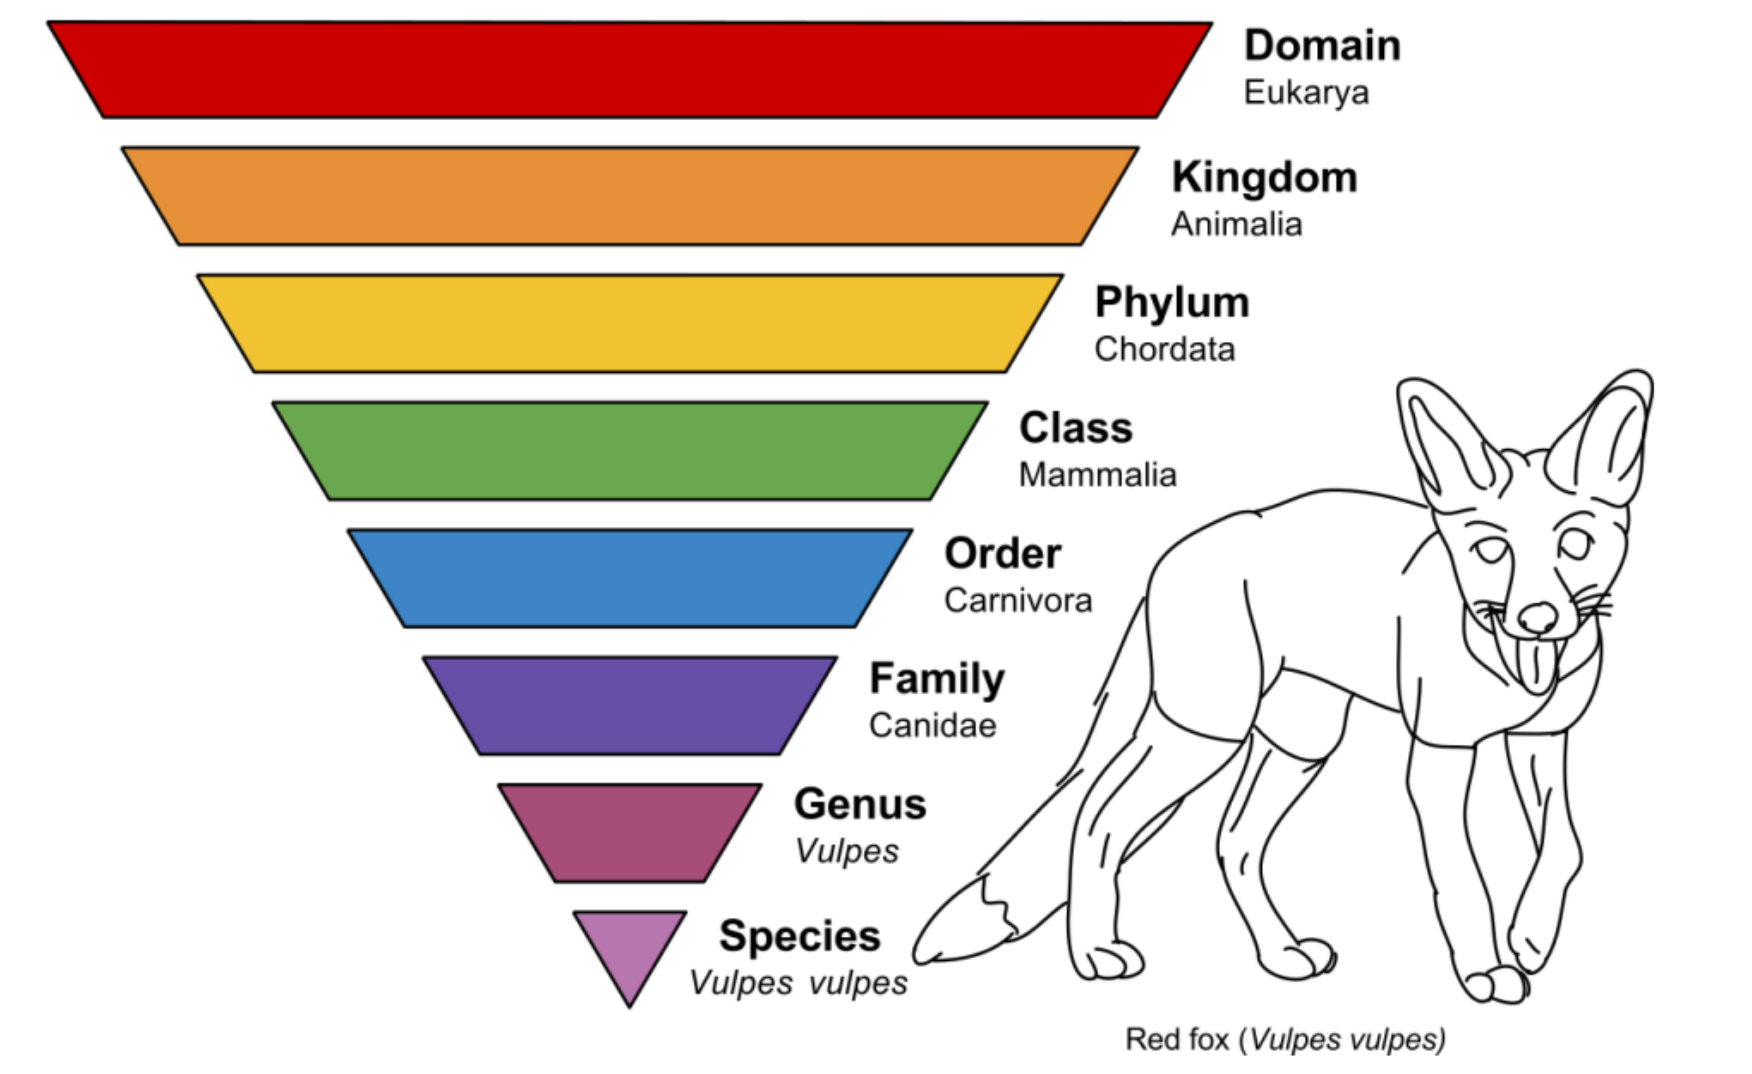
- Morphological Data 🦴
→ Physical structures and forms (like bones, body shapes, or organs).
Example: Forelimbs of whales, cats, and humans show similar bone structures = common ancestry. - Molecular Data 🧬
→ DNA or protein sequence comparisons between species.
The more similar the sequences, the more closely related two species are.
💡 DNA is the most reliable evidence for relationships! - Developmental Data
→ Embryo development patterns across species.
Example: All vertebrate embryos (fish, birds, humans) have gill slits early on. - Fossil Evidence ⛏️
→ Fossils show transitional forms and how organisms changed over time.
Example: Fossils of feathered dinosaurs link birds to reptiles. - Behavioral Traits 🐒
→ Similar behaviors (especially instinctual ones) may suggest a shared origin.
Example: Primate social behavior and grooming patterns. - Biogeography 🌍
→ Where organisms live now vs. where their ancestors lived.
Example: Marsupials found mostly in Australia due to continental drift.
🧠 Why It Matters:
All this evidence helps scientists build phylogenetic trees (family trees of life) to show how species are related and when they may have diverged from common ancestors.
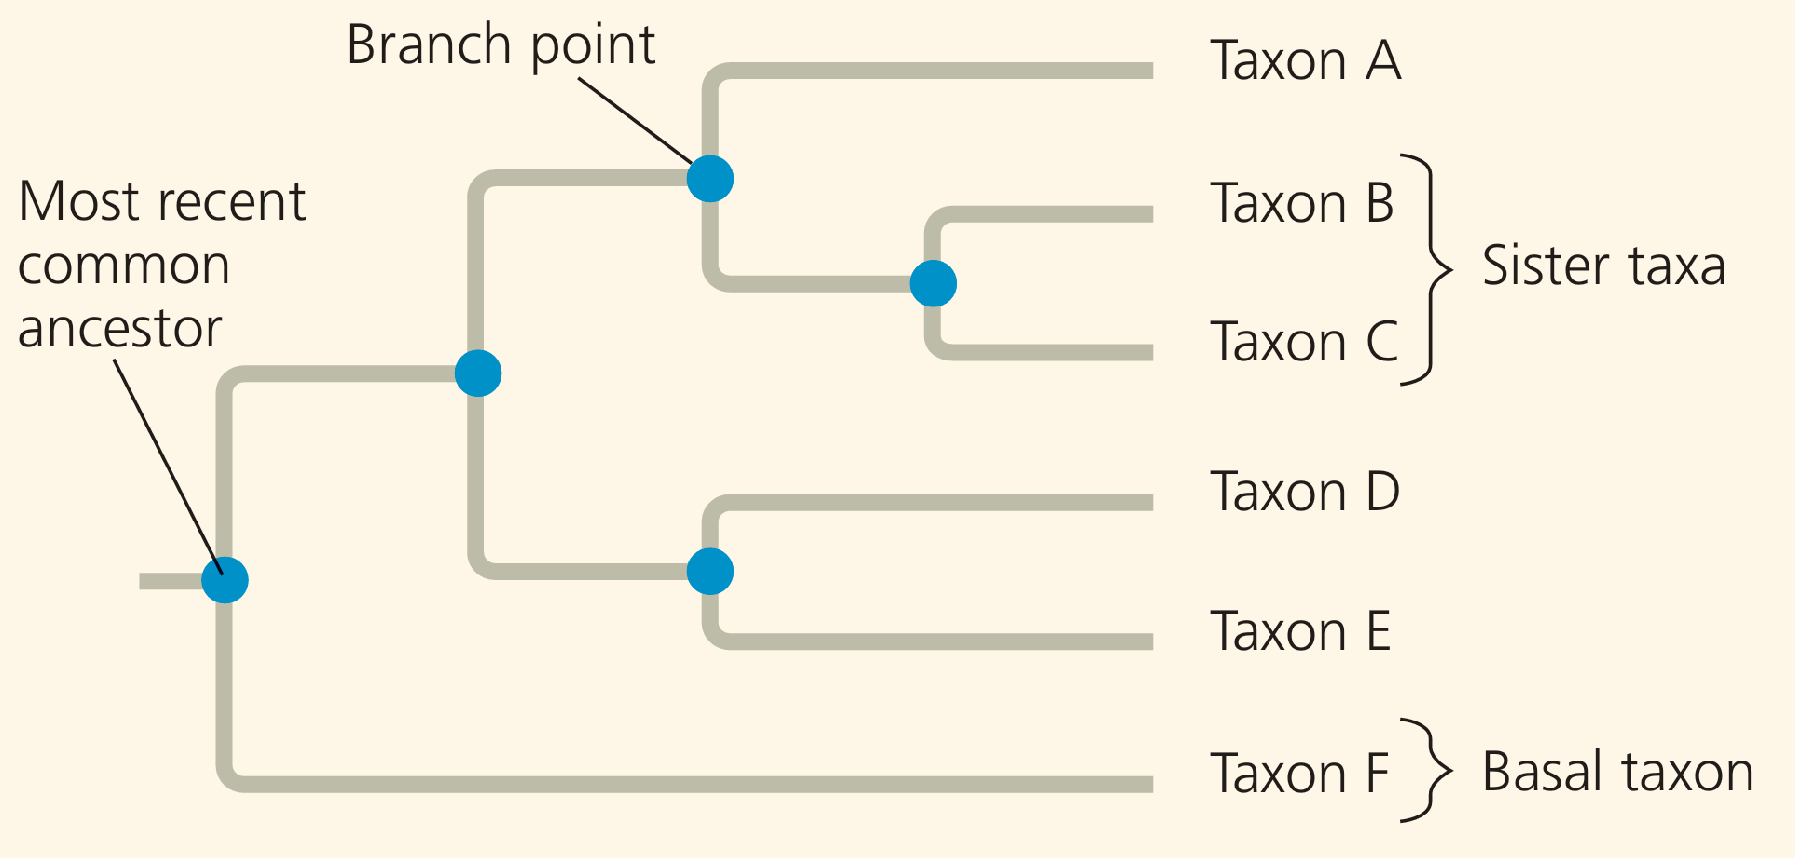
7.9.A.1 – Phylogenetic Trees & Cladograms
🌳 What Are They?
Phylogenetic trees and cladograms are diagrams that show hypothesized evolutionary relationships between species or lineages — like a “family tree” for organisms.
🧪 Key Ideas:
Hypotheses, Not Facts!
- These trees are not absolute truths – they’re based on current data (DNA, fossils, morphology) and can be tested or changed when new data is found.
Common Ancestry
- The branches on the tree represent divergence from a common ancestor.

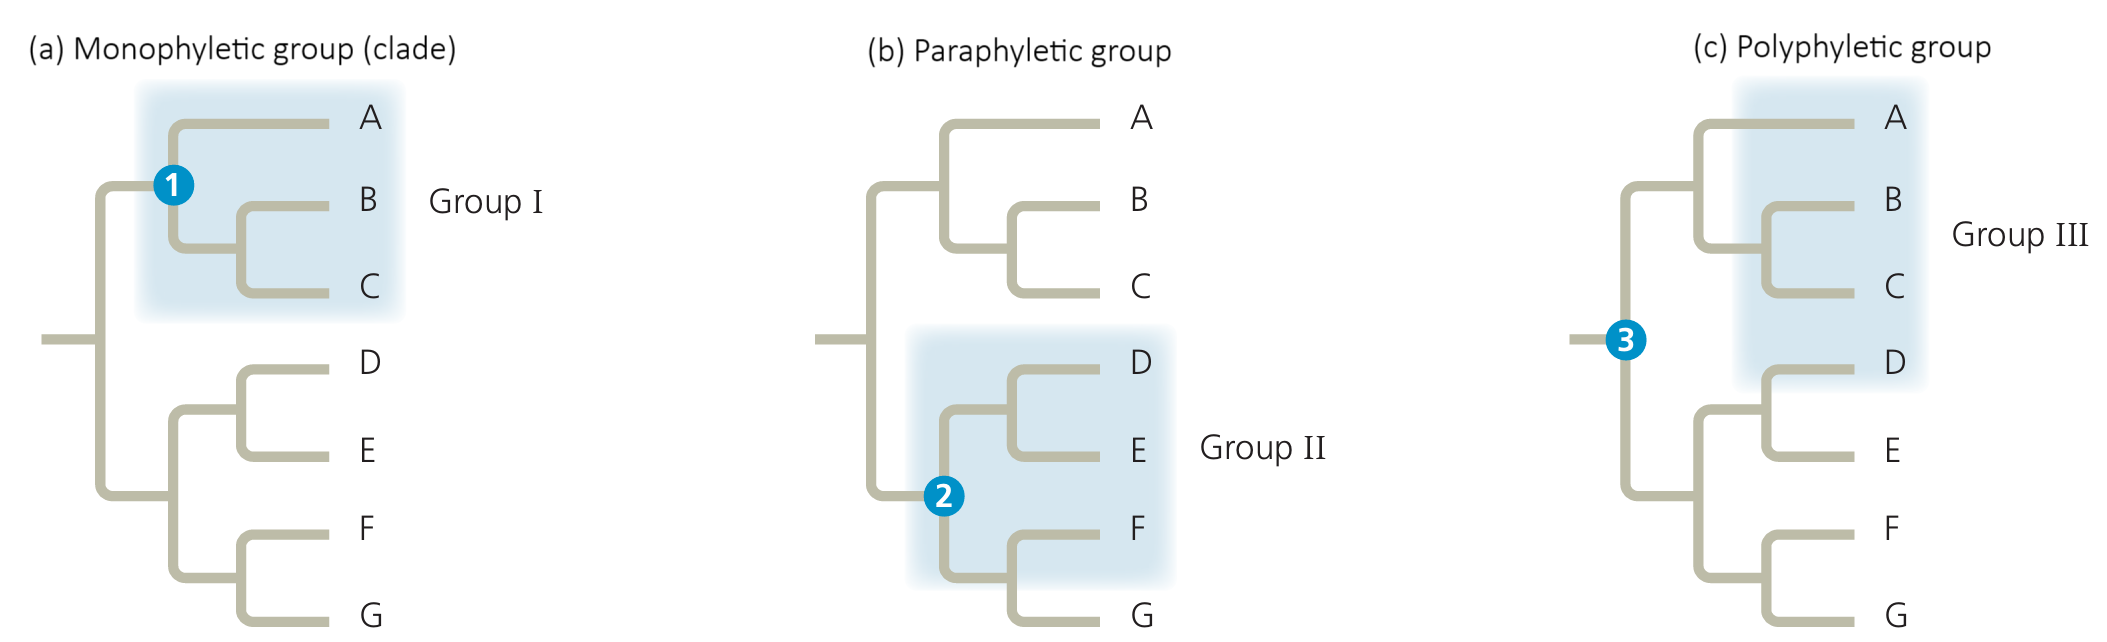
Clades
- A clade = a group of organisms that includes an ancestor and all its descendants.
- Example: Birds + dinosaurs = same clade
Nodes
- Points where branches split = a common ancestor of the diverging species.
Root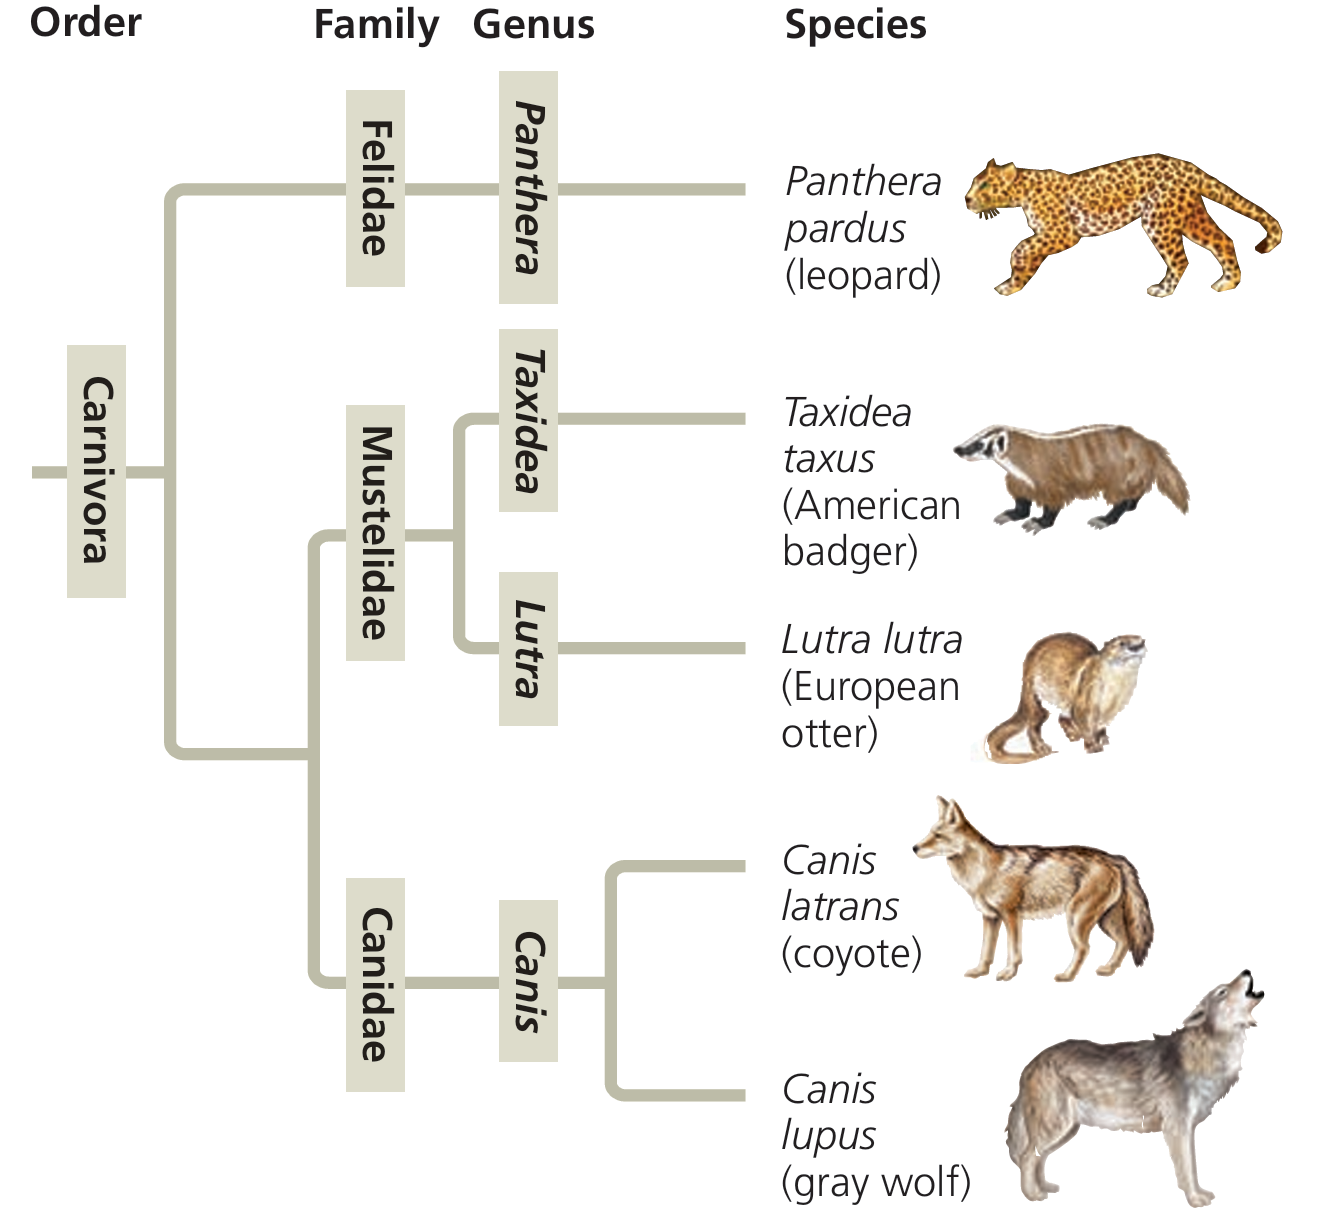
- The base of the tree = the most recent common ancestor of all organisms on the tree.
Branch Length (in some trees)
- Sometimes branch length shows amount of change or time.
🔍 How We Build Them:
- DNA/protein sequence comparisons
- Shared derived traits (synapomorphies)
- Fossil records
📌 Remember:
“Phylogenetic trees & cladograms are models – they help us visualize and test evolutionary relationships using real data.”
7.9.A.2 – Difference Between Phylogenetic Trees & Cladograms
🌳 Phylogenetic Trees vs. Cladograms
| Feature | Phylogenetic Tree 🌿 | Cladogram 🌱 |
|---|---|---|
| Purpose | Shows evolutionary relationships + time or genetic change | Shows evolutionary relationships only |
| Time Scale | Yes, time is often shown (calibrated with fossils or molecular clock) | No time scale included |
| Branch Length | Branch length can show amount of evolutionary change or time | Branches are usually equal – no info about time or change |
| Used For | Estimating how much species changed over time | Showing which species are more closely related |
⏳ What is a Molecular Clock?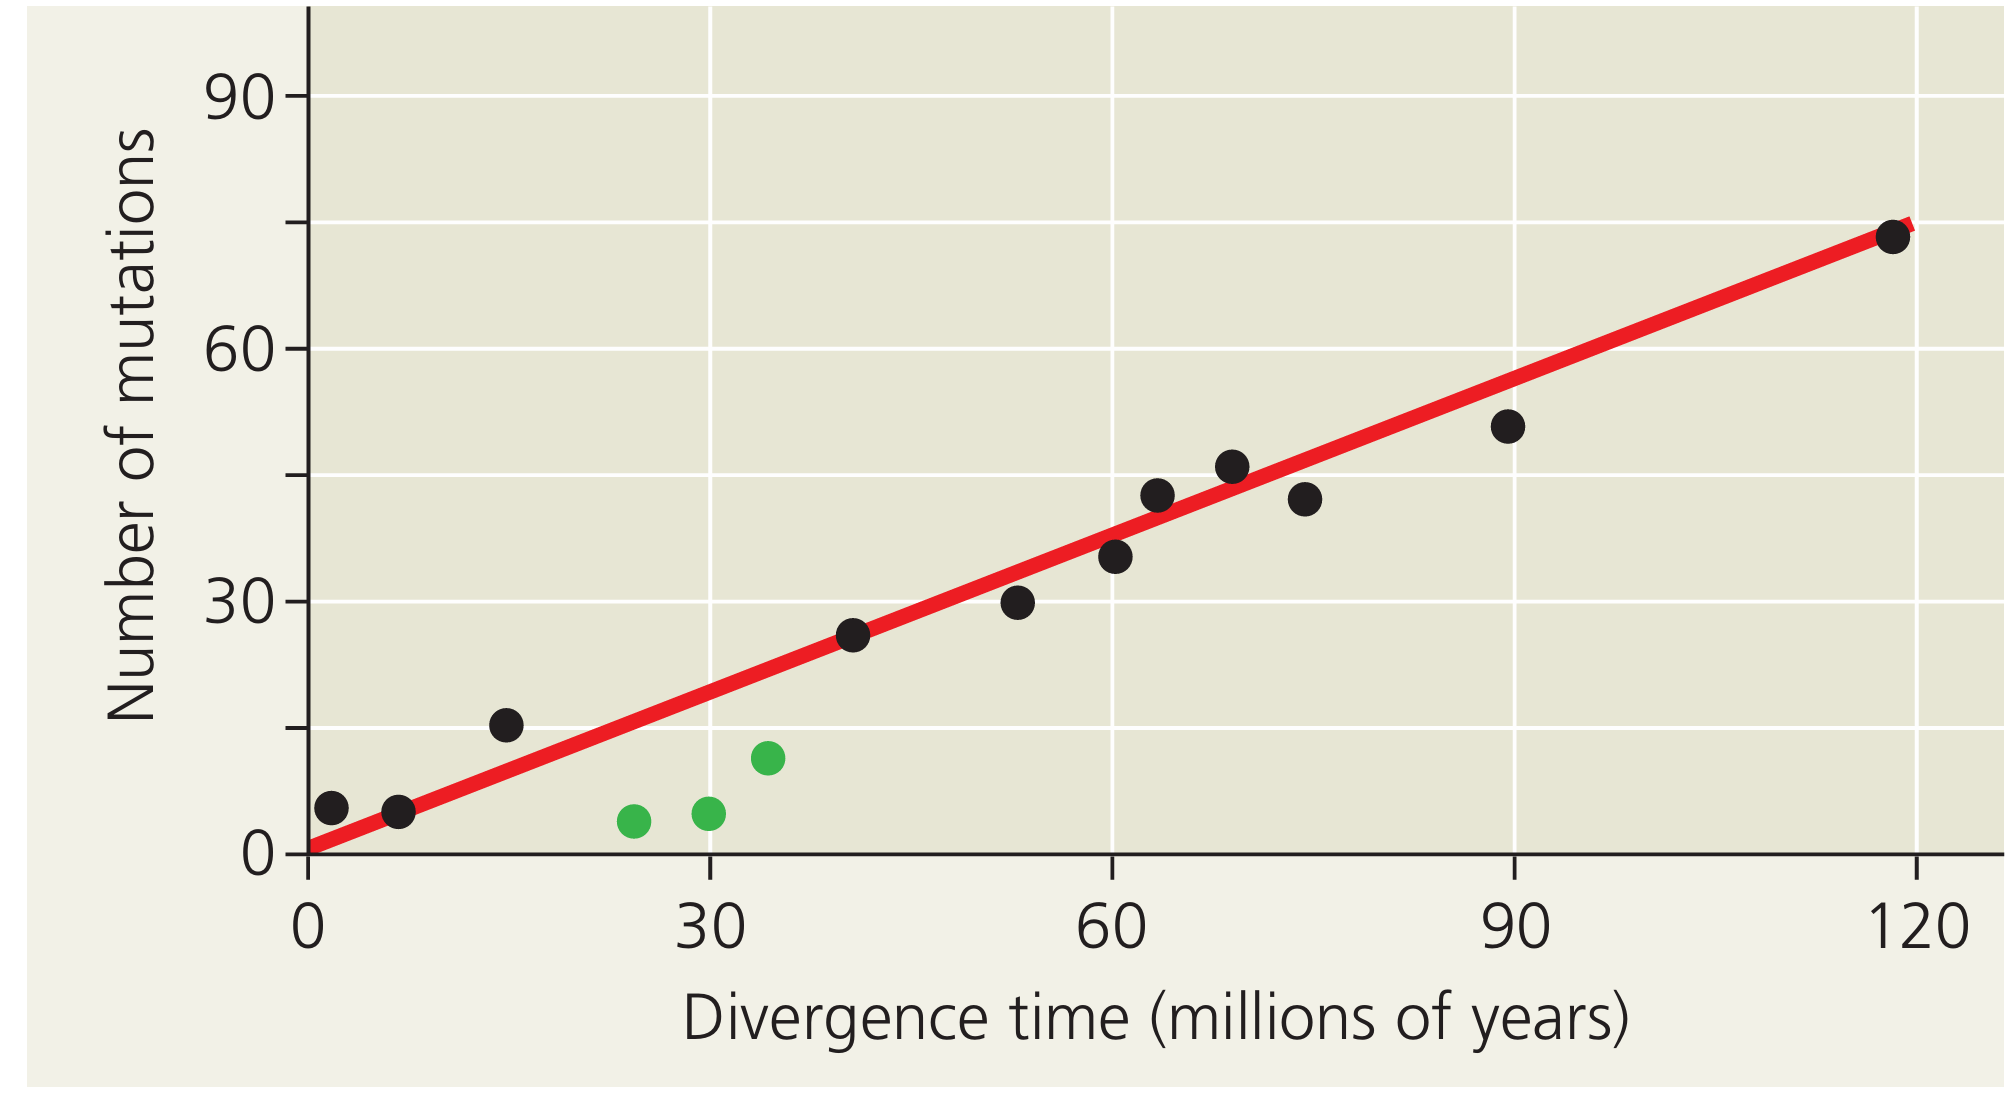
It estimates how long-ago species diverged based on the rate of mutations in their DNA.
Useful in phylogenetic trees to calculate time since common ancestors.
📌 Example:
A phylogenetic tree might show that whales and hippos diverged 55 million years ago.
A cladogram would just show they share a common ancestor – but not when or how much they changed.
7.9.A.3 – Using Traits to Build Phylogenetic Trees & Cladograms
🌱 How Traits Help Us Build Trees and Cladograms: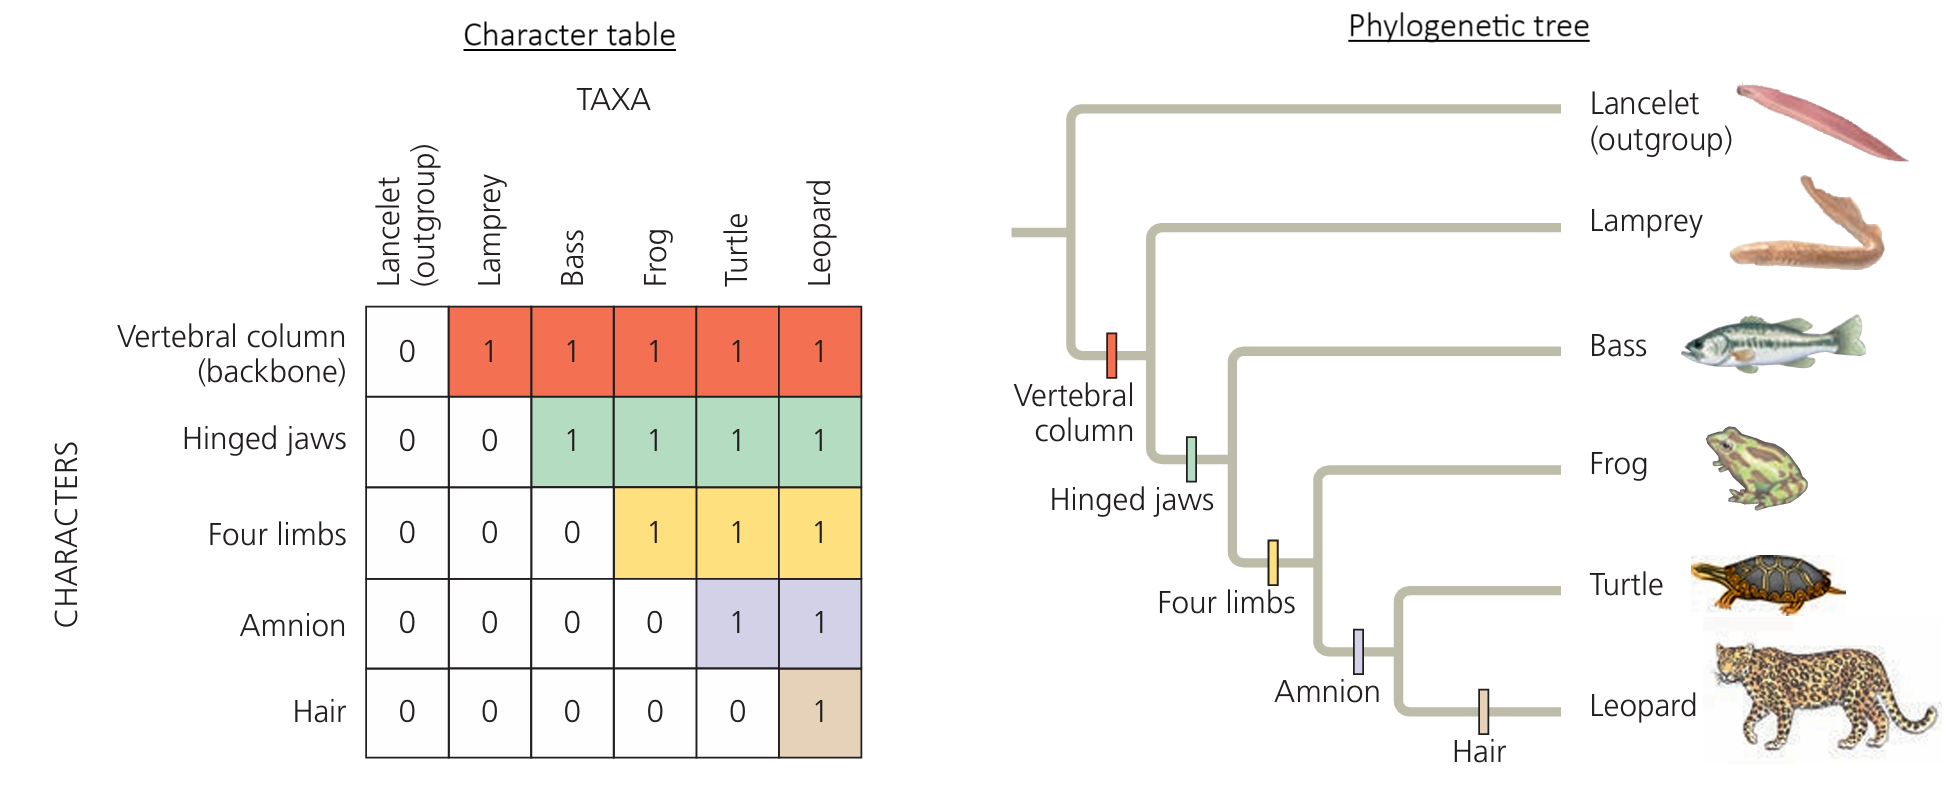
When scientists try to figure out how species are related, they look at traits like physical features or DNA sequences to map out evolutionary family trees.
🔍 Key Concepts
Traits Gained or Lost = Evolutionary Clues
- Traits (like feathers, or the loss of a tail) that appear or disappear during evolution help us group organisms.
- These can show how closely two species are related.
Outgroup = The Distant Relative 🧬
- An outgroup is a species (or group) that’s less closely related to the others.
- It’s used as a reference point to compare the rest of the species in the tree.
- It helps identify which traits are ancestral (old) vs. derived (new).
Shared Derived Traits = Common Ancestry
- A shared derived character is a new trait that shows up in more than one group and came from a common ancestor.
- These are super useful when building trees because they tell us who’s related to whom.
- Example: Fur is a shared derived trait for mammals.
🧬 Why Molecular Data > Morphological Data
- Physical traits can evolve independently (convergent evolution).
- DNA gives us the actual genetic changes between organisms.
- Molecular clocks help estimate when species split.
🧭 Summary Table
| Type of Evidence | Reliability | Why It Matters |
|---|---|---|
| Morphological traits | Moderate | Can mislead due to convergent evolution |
| Molecular data | High | More precise, based on actual genetic sequences |
7.9.B.1 – How Trees & Cladograms Show Speciation
🧬 What does the tree tell us?
Phylogenetic trees and cladograms aren’t just for decoration they actually illustrate when speciation happened, meaning when one species split into two or more new ones!
🌱 What’s a Node?
- A node is a branching point on the tree.
- It represents the most recent common ancestor between two organisms or groups.
- From that node, new branches represent new species that evolved from that ancestor.
 From that node, new branches represent new species that evolved from that ancestor.
📌 Example:
A node splits into two branches:
- One branch = lions 🦁
- Other branch = tigers 🐯
That node represents the shared ancestor of both lions and tigers the point where speciation occurred.
🧠 Why these matters:
- It helps us understand how biodiversity increases over time.
- We can trace back evolutionary paths to find how different species are related.
- Scientists use it to study adaptive radiation, where one species gives rise to many.
💡 Simple Insight:
Every time you see a node, think: “Here’s where one species split into two!”
This is exactly how evolution leaves a trail we can follow.