Question 1
Most-appropriate topic codes (AP Biology 2025 Course Framework):
• Science Practice 3: Questions and Methods (identifying variables/controls) — parts B.i, B.ii, C.i
• Science Practice 5: Statistical Tests and Data Analysis (graph interpretation/calculations) — parts B.iii, C.ii, C.iii
• Science Practice 6: Argumentation (supporting claims with evidence) — part D.i
• Topic 2.1.A.3 & 2.9.B.1: Endoplasmic reticulum and compartmentalization — part D.ii
▶️ Answer/Explanation
(A)
Ribosomes are the cellular structures where protein synthesis (translation) occurs. They facilitate the assembly of amino acids into polypeptide chains by reading mRNA sequences and catalyzing the formation of peptide bonds.
✅ Answer: \( \boxed{\text{Ribosomes synthesize proteins via translation.}} \)
B(i)
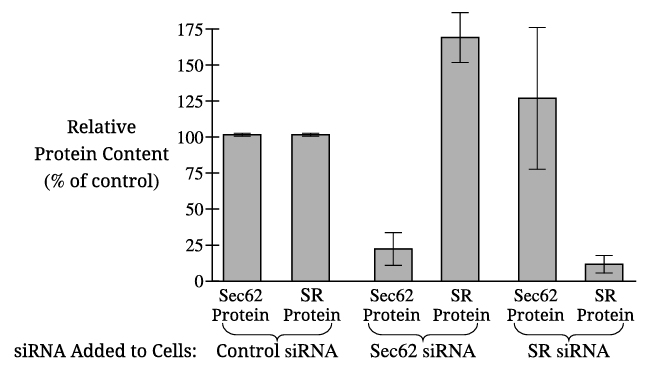
The dependent variable in Figure 1 is the relative protein content (percentage of control) of Sec62 and SR proteins.
✅ Answer: \( \boxed{\text{Relative protein content (of Sec62 and SR)}} \)
B(ii)
The control with Sec62 siRNA alone allows researchers to determine whether this siRNA specifically reduces Sec62 expression without affecting SR expression, confirming the siRNA’s specificity and validating the experimental design.
✅ Answer: \( \boxed{\text{To confirm that Sec62 siRNA specifically targets only Sec62 and does not affect SR protein levels.}} \)
B(iii)
When cells are treated with Sec62 siRNA, the production of SR protein increases significantly (approximately 65% above the control level).
✅ Answer: \( \boxed{\text{SR protein production increases by about 65%.}} \)
C(i)
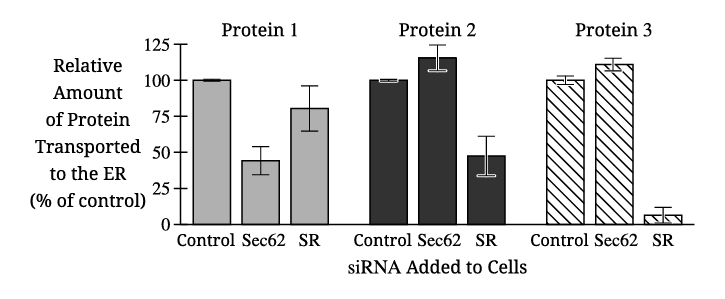
The independent variable in Figure 2 is the type of siRNA added to the cells (control, Sec62 siRNA, or SR siRNA).
✅ Answer: \( \boxed{\text{Type of siRNA treatment}} \)
C(ii)
Proteins 2 and 3 both show an increase in percent transport to the ER when treated with Sec62 siRNA compared to the control.
✅ Answer: \( \boxed{\text{Proteins 2 and 3}} \)
C(iii)
Each amino acid is encoded by 3 nucleotides.
Protein 1 amino acids: \( \frac{234}{3} = 78 \)
Protein 2 amino acids: \( \frac{495}{3} = 165 \)
Difference: \( 165 – 78 = 87 \) amino acids.
✅ Answer: \( \boxed{87} \)
D(i)
Only Protein 1 shows a significant decrease in transport when Sec62 siRNA is applied. Since Sec62 is required for post-translational ER transport, this indicates Protein 1 relies on Sec62 and is therefore transported after translation is complete.
✅ Answer: \( \boxed{\text{Protein 1 transport decreases with Sec62 siRNA, indicating Sec62 dependence and post-translational transport.}} \)
D(ii)
Amino acids near the amino terminus interact first with the protein channel. Their polarity/charge relative to the channel interior determines ease of passage: hydrophobic or oppositely charged residues facilitate movement, while hydrophilic or similarly charged residues hinder it. This is consistent with principles of selective permeability and protein-channel interactions.
✅ Answer: \( \boxed{\text{Amino acids at the N-terminus determine compatibility with the channel’s chemical environment, influencing translocation likelihood.}} \)
Question 2
Table 1. Average General and Oriented Activity in Male Moths Injected With Saline or siRNA Molecules
| Treatment | General Activity (percent of total time observed, average ±2SE\(_x\)) | Oriented Activity (percent of general activity, average ±2SE\(_x\)) |
|---|---|---|
| Male moths injected with saline (control solution) | 95 ± 5 | 60 ± 4 |
| Male moths injected with siRNAs that inhibit expression of the gene encoding DopEcR | 90 ± 8 | 25 ± 6 |
Most-appropriate topic codes (AP Biology 2025 Course Framework):
• Science Practice 4: Representing and Describing Data (graph construction) — part B.i
• Science Practice 5: Statistical Tests and Data Analysis (data interpretation) — parts B.ii, C.i
• Topic 4.2.B.1: Signal transduction pathways — part C.ii
• Science Practice 6: Argumentation (supporting claims) — part D.i
• Topic 4.3.B.2: Chemical effects on signaling pathways — part D.ii
▶️ Answer/Explanation
(a)
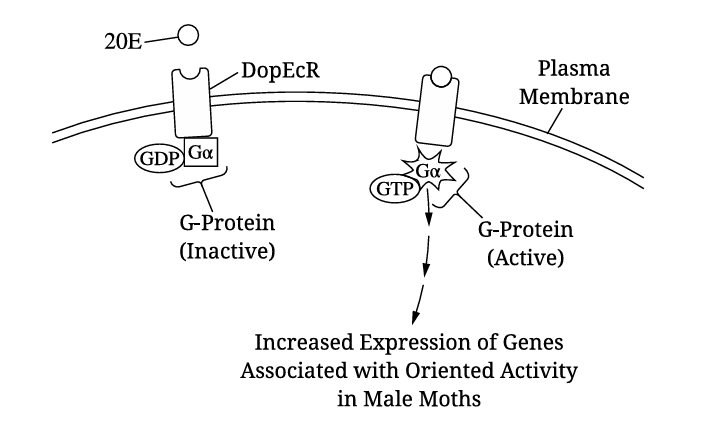
The portion of the receptor embedded inside the lipid bilayer is hydrophobic/nonpolar to interact with the fatty acid tails of phospholipids.
✅ Answer: \(\boxed{\text{Hydrophobic / Nonpolar}}\)
(b)(i)
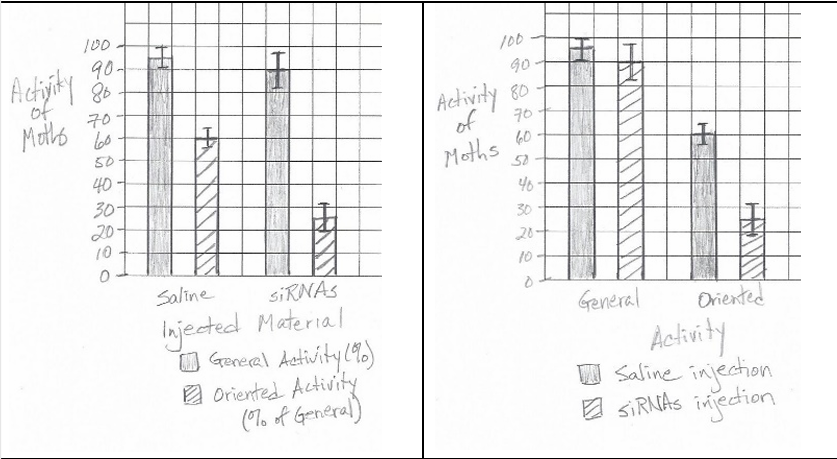
A bar graph with error bars should be constructed. The x-axis should show the two treatments (Control and siRNA), with two bars per treatment (one for General Activity, one for Oriented Activity). The y-axis should be labeled “Percent Activity.” Error bars should be plotted using the given ±SE\(_x\) values.
✅ Key points: Correct graph type, accurate plotting of data and error bars, proper labeling.
(b)(ii)
Oriented activity was significantly reduced in siRNA-treated moths (25% vs. 60% in control), while general activity was less affected.
✅ Answer: \(\boxed{\text{Oriented activity}}\)
(c)(i)
The control group (saline-injected moths) had oriented activity at 60% of general activity, which is >50%.
✅ Answer: \(\boxed{\text{Control / Saline-injected group}}\)
(c)(ii)
The mutation prevents G-protein activation, blocking signal transduction. This would decrease oriented activity because genes associated with oriented behavior would not be transcribed.
✅ Answer: \(\boxed{\text{Decreased oriented activity}}\)
(d)(i)
Increased DopEcR expression at sexual maturity allows more 20E binding and stronger signaling, leading to increased oriented activity toward pheromones, thereby improving mating success.
✅ Evidence: Data show that inhibiting DopEcR reduces oriented activity; thus, increasing it should enhance oriented activity and mate-finding.
(d)(ii)
An inhibitor of the DopEcR pathway would reduce oriented activity toward pheromones, decreasing mating success and population growth, thus reducing crop damage from moth larvae.
✅ Explanation: Less oriented activity → fewer matings → lower reproduction → fewer larvae damaging crops.
Question 5
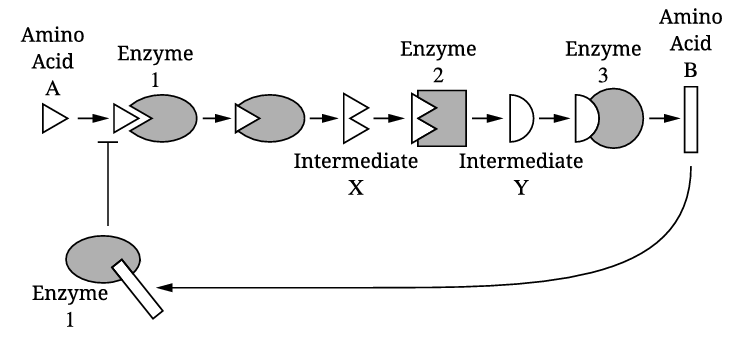
Figure 1. Synthesis of amino acid B from amino acid A
Most-appropriate topic codes (AP Biology 2025):
• Topic 4.4.A.1: Feedback mechanisms — part B
• Topic 3.3.A.3: Sequential metabolic pathways — part C
• Topic 3.2.A.1: Environmental effects on enzymes — part D
▶️ Answer/Explanation
(a)
The active site of an enzyme has a specific three-dimensional shape and charge distribution that is complementary to its substrate(s). This precise compatibility allows the enzyme to bind specifically to its substrate and lower the activation energy for the reaction.
✅ Answer: \(\boxed{\text{Specific shape/complementarity to substrate}}\)
(b)
Amino acid B acts as a noncompetitive (allosteric) inhibitor of enzyme 1. It binds to an allosteric site on enzyme 1, causing a conformational change that reduces enzyme 1’s activity and prevents amino acid A from binding to the active site. This is an example of feedback inhibition in a metabolic pathway.
✅ Answer: \(\boxed{\text{B binds allosterically to inhibit enzyme 1}}\)
(c)
According to Figure 1, enzyme 2 catalyzes the conversion of intermediate X into intermediate Y. Therefore, the product of the reaction catalyzed by enzyme 2 is intermediate Y.
✅ Answer: \(\boxed{\text{Intermediate Y}}\)
(d)
A change in pH outside the optimal range for enzyme 3 can disrupt the hydrogen bonds and ionic interactions that maintain the enzyme’s tertiary structure. This can lead to denaturation, altering the shape of the active site so that intermediate Y can no longer bind effectively, preventing the production of amino acid B.
✅ Answer: \(\boxed{\text{pH change can denature enzyme 3 / alter active site shape}}\)
Question 6
Figure 1A. Percent of Metaphase Cells with ALD-Associated Filaments
Figure 1B. ALD Protein (Western Blot)

Most-appropriate topic codes (AP Biology 2025):
• Science Practice 6: Argumentation (hypothesis support) — part C
• Topic 6.7.A.1 & 1.7.A.6: Mutation effects and protein structure-function — part D
▶️ Answer/Explanation
(a)
Method: Examine Figure 1A, which is a bar graph showing the average percent of metaphase cells with ALD-associated filaments for different genotypes. Identify the bar with a height closest to the 12% mark on the y-axis.
✅ Answer: \(\boxed{ald1/del}\)
(b)
Method: Examine Figure 1B, which is a Western blot. The thickness of each band correlates with the amount of ALD protein produced. Compare the band for the \( ald3/ald23 \) genotype to the band for the \( ald23/del \) genotype.
✅ Answer: \(\boxed{\text{Cells with genotype } ald3/ald23 \text{ produce more ALD protein than cells with genotype } ald23/del \text{, which produce little to no ALD protein.}}\)
(c)
Method: To support the hypothesis, find a pair of genotypes where one produces about half the protein of the wild-type (WT/WT) but has a similar percentage of cells with filaments. Compare the WT/WT and WT/del data points in both figures.
- In Figure 1B, the band for WT/del is visibly thinner than for WT/WT, indicating it produces about half the amount of ALD protein.
- In Figure 1A, the bars for WT/WT and WT/del are both near 100%, showing no significant difference in the percentage of cells with filaments.
This direct comparison shows that halving the protein amount does not reduce filament formation, supporting the hypothesis.
✅ Answer: \(\boxed{\text{The WT/del cells produce about half the ALD protein of WT/WT cells (Fig 1B), yet the percent of cells with filaments is similarly high (Fig 1A), supporting the hypothesis.}}\)
(d)
Method: Analyze why two genotypes (WT/del and ald1/del) with similar protein amounts (medium bands in Fig 1B) have vastly different phenotypes (function) (~100% vs. ~12% cells with filaments in Fig 1A). The difference must lie in the quality or functionality of the protein produced.
- The \( del \) allele produces no protein.
- The \( WT \) allele produces normal, functional protein.
- The \( ald1 \) allele produces a protein, but the mutation likely makes it non-functional or less effective.
Therefore, WT/del cells have one functional allele and produce enough working protein for normal filament formation. The ald1/del cells produce a similar amount of protein, but the protein from the ald1 allele is defective, leading to the mutant phenotype.
✅ Answer: \(\boxed{\text{The } ald1 \text{ mutation produces a non-functional or less effective ALD protein, whereas the } WT \text{ allele produces functional protein. Thus, } WT/del \text{ cells have functional protein and a normal phenotype, while } ald1/del \text{ cells do not.}}\)