Question

The graph of the function f is shown in the figure above. Which of the following statements about f is true?
(A) \(\lim_{x\rightarrow a}f(x)=\lim_{x\rightarrow b}f(x)\)
(B) \(\lim_{x\rightarrow a}f(x)=2\)
(C) \(\lim_{x\rightarrow b}f(x)=2\)
(D) \(\lim_{x\rightarrow a}f(x)=1\)
(E) \(\lim_{x\rightarrow a}f(x)\) does not exist
▶️ Answer/Explanation
Solution
Correct Answer: B
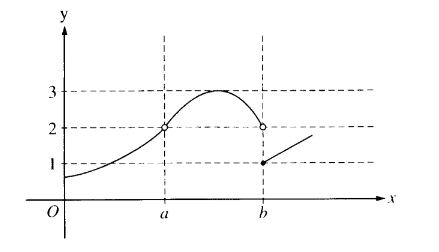
The limit as x approaches ‘a’ from both sides (left and right) equals 2.
This means \(\lim_{x\rightarrow a}f(x) = 2\) exists and is well-defined.
For option A: The limits at a and b are not equal (limit at b doesn’t exist).
For option C: The limit at b doesn’t exist because left and right limits differ.
For option D: The limit at a is 2, not 1.
For option E: The limit at a does exist (it’s 2).
Therefore, only statement B is correct.
Question
The position of a particle moving to the right on the x-axis is given by x(t), where x(t) is measured in centimeters and t is measured in seconds for 0 ≤ t ≤ 50. If y = x(t) is a linear function, which of the following would most likely give the best estimate of the speed of the particle, in centimeters per second, at time t = 10 seconds?
A) x(10)
B) \(\frac{x(10)}{10}\)
C) x(11) – x(9)
D) The slope of the graph of y = x(t)
▶️ Answer/Explanation
Solution
Correct Answer: D
– For a linear function x(t), the speed is constant and equal to its slope.
– Option D gives the exact value of the speed (slope) at any time t in [0,50].
Why other options are incorrect:
– A) x(10) gives position, not speed
– B) \(\frac{x(10)}{10}\) gives average speed from 0 to 10, not instantaneous speed
– C) x(11)-x(9) gives average speed over [9,11], which equals the constant speed but is less direct than D
Therefore, option D is the most appropriate choice.
Question

A model rocket leaves the ground at time t=0 and travels straight up from the ground. The height, in feet, of the rocket above the ground is given by y(t), where t is measured in seconds for 0 ≤ t ≤ 120. Values of y(t) for selected values of t are given in the table above. Of the following values of t, at which value would the velocity of the rocket most likely be greatest based on the data in the table?
A) t=20
B) t=40
C) t=60
D) t=80
▶️ Answer/Explanation
Solution
Correct Answer: D
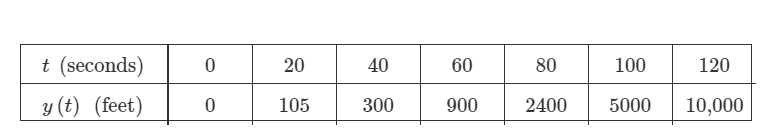
– Velocity can be estimated by the change in height (Δy) over change in time (Δt)
– From the table data, the greatest height difference occurs between t=60 and t=80 for t=20 till t =80
– Therefore, the rocket’s velocity is highest around t=80
Analysis of the options:
• A) t=20 – Early stage, velocity still increasing
• B) t=40 – Velocity greater than at t=20 but not maximum
• C) t=60 – Velocity increasing but not yet peak
• D) t=80 – Shows the largest Δy/Δt, indicating maximum velocity
The data shows increasing velocity with time, making t=80 the most likely point of maximum velocity among the options.
Question

A particle is moving on the x-axis and the position of the particle at time t is given by x(t), whose graph is given above. Which of the following is the best estimate for the speed of the particle at time t = 4?
A) 0
B) 5
C) \(\frac{20}{3}\)
D) 20
▶️ Answer/Explanation
Solution
Correct Answer: A
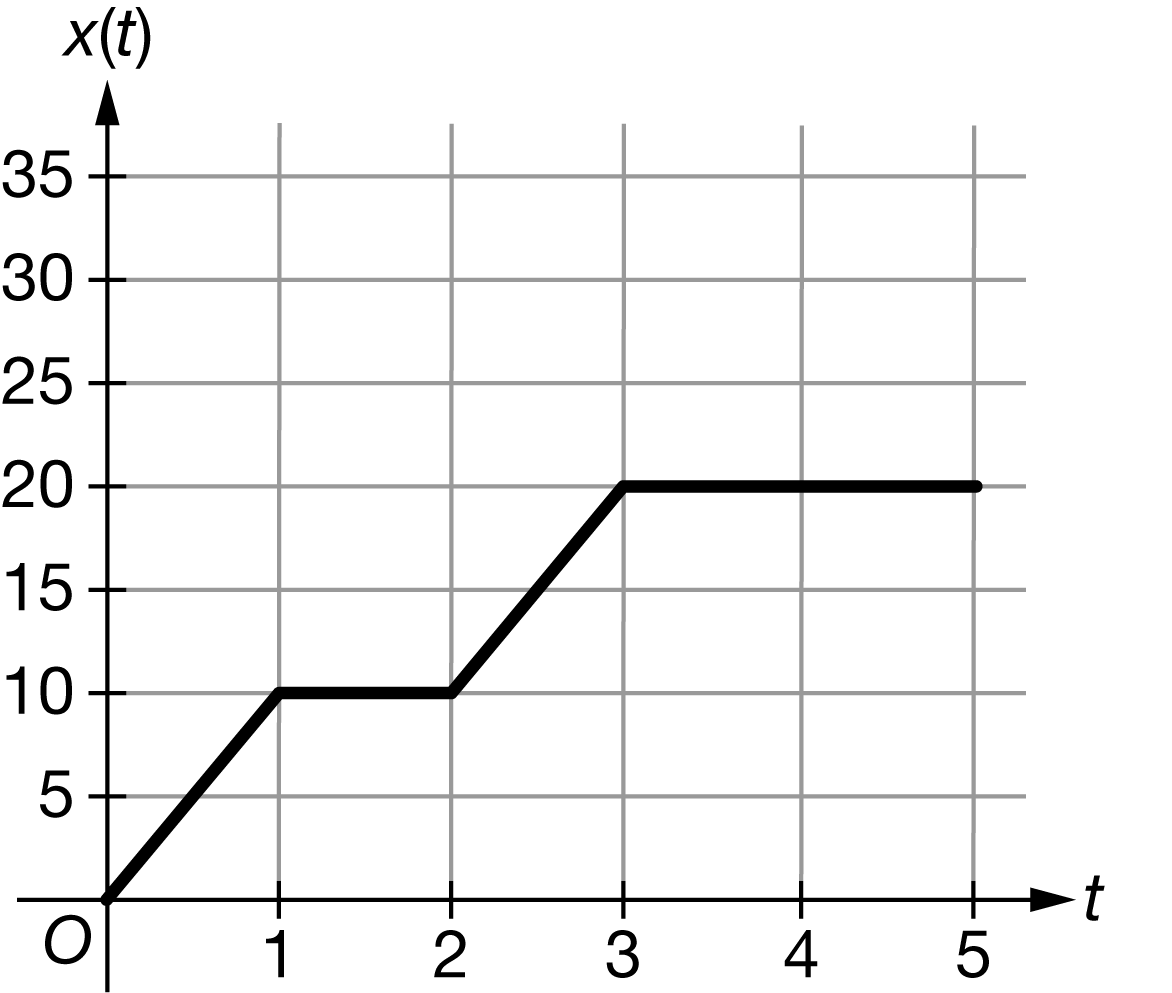
– Speed is determined by the slope of the position-time graph (x(t) vs t)
– At t=4, the graph shows a horizontal tangent (zero slope)
– This indicates the particle is momentarily at rest
Analysis of the graph:
• The curve reaches its maximum at t=4 (x=20)
• The instantaneous rate of change (derivative) is zero at this point
• Therefore, the speed is exactly 0 at t=4
Why other options are incorrect:
– B) 5: Would represent a non-zero slope
– C) 20/3: Average speed over some interval
– D) 20: The position value, not speed
The horizontal tangent at t=4 clearly indicates zero velocity.